30 Day Map Challenge 2020
vicky johnson-dahl
cartographer, dc
twitter // email
(more about the map challenge)
November 30: A Map
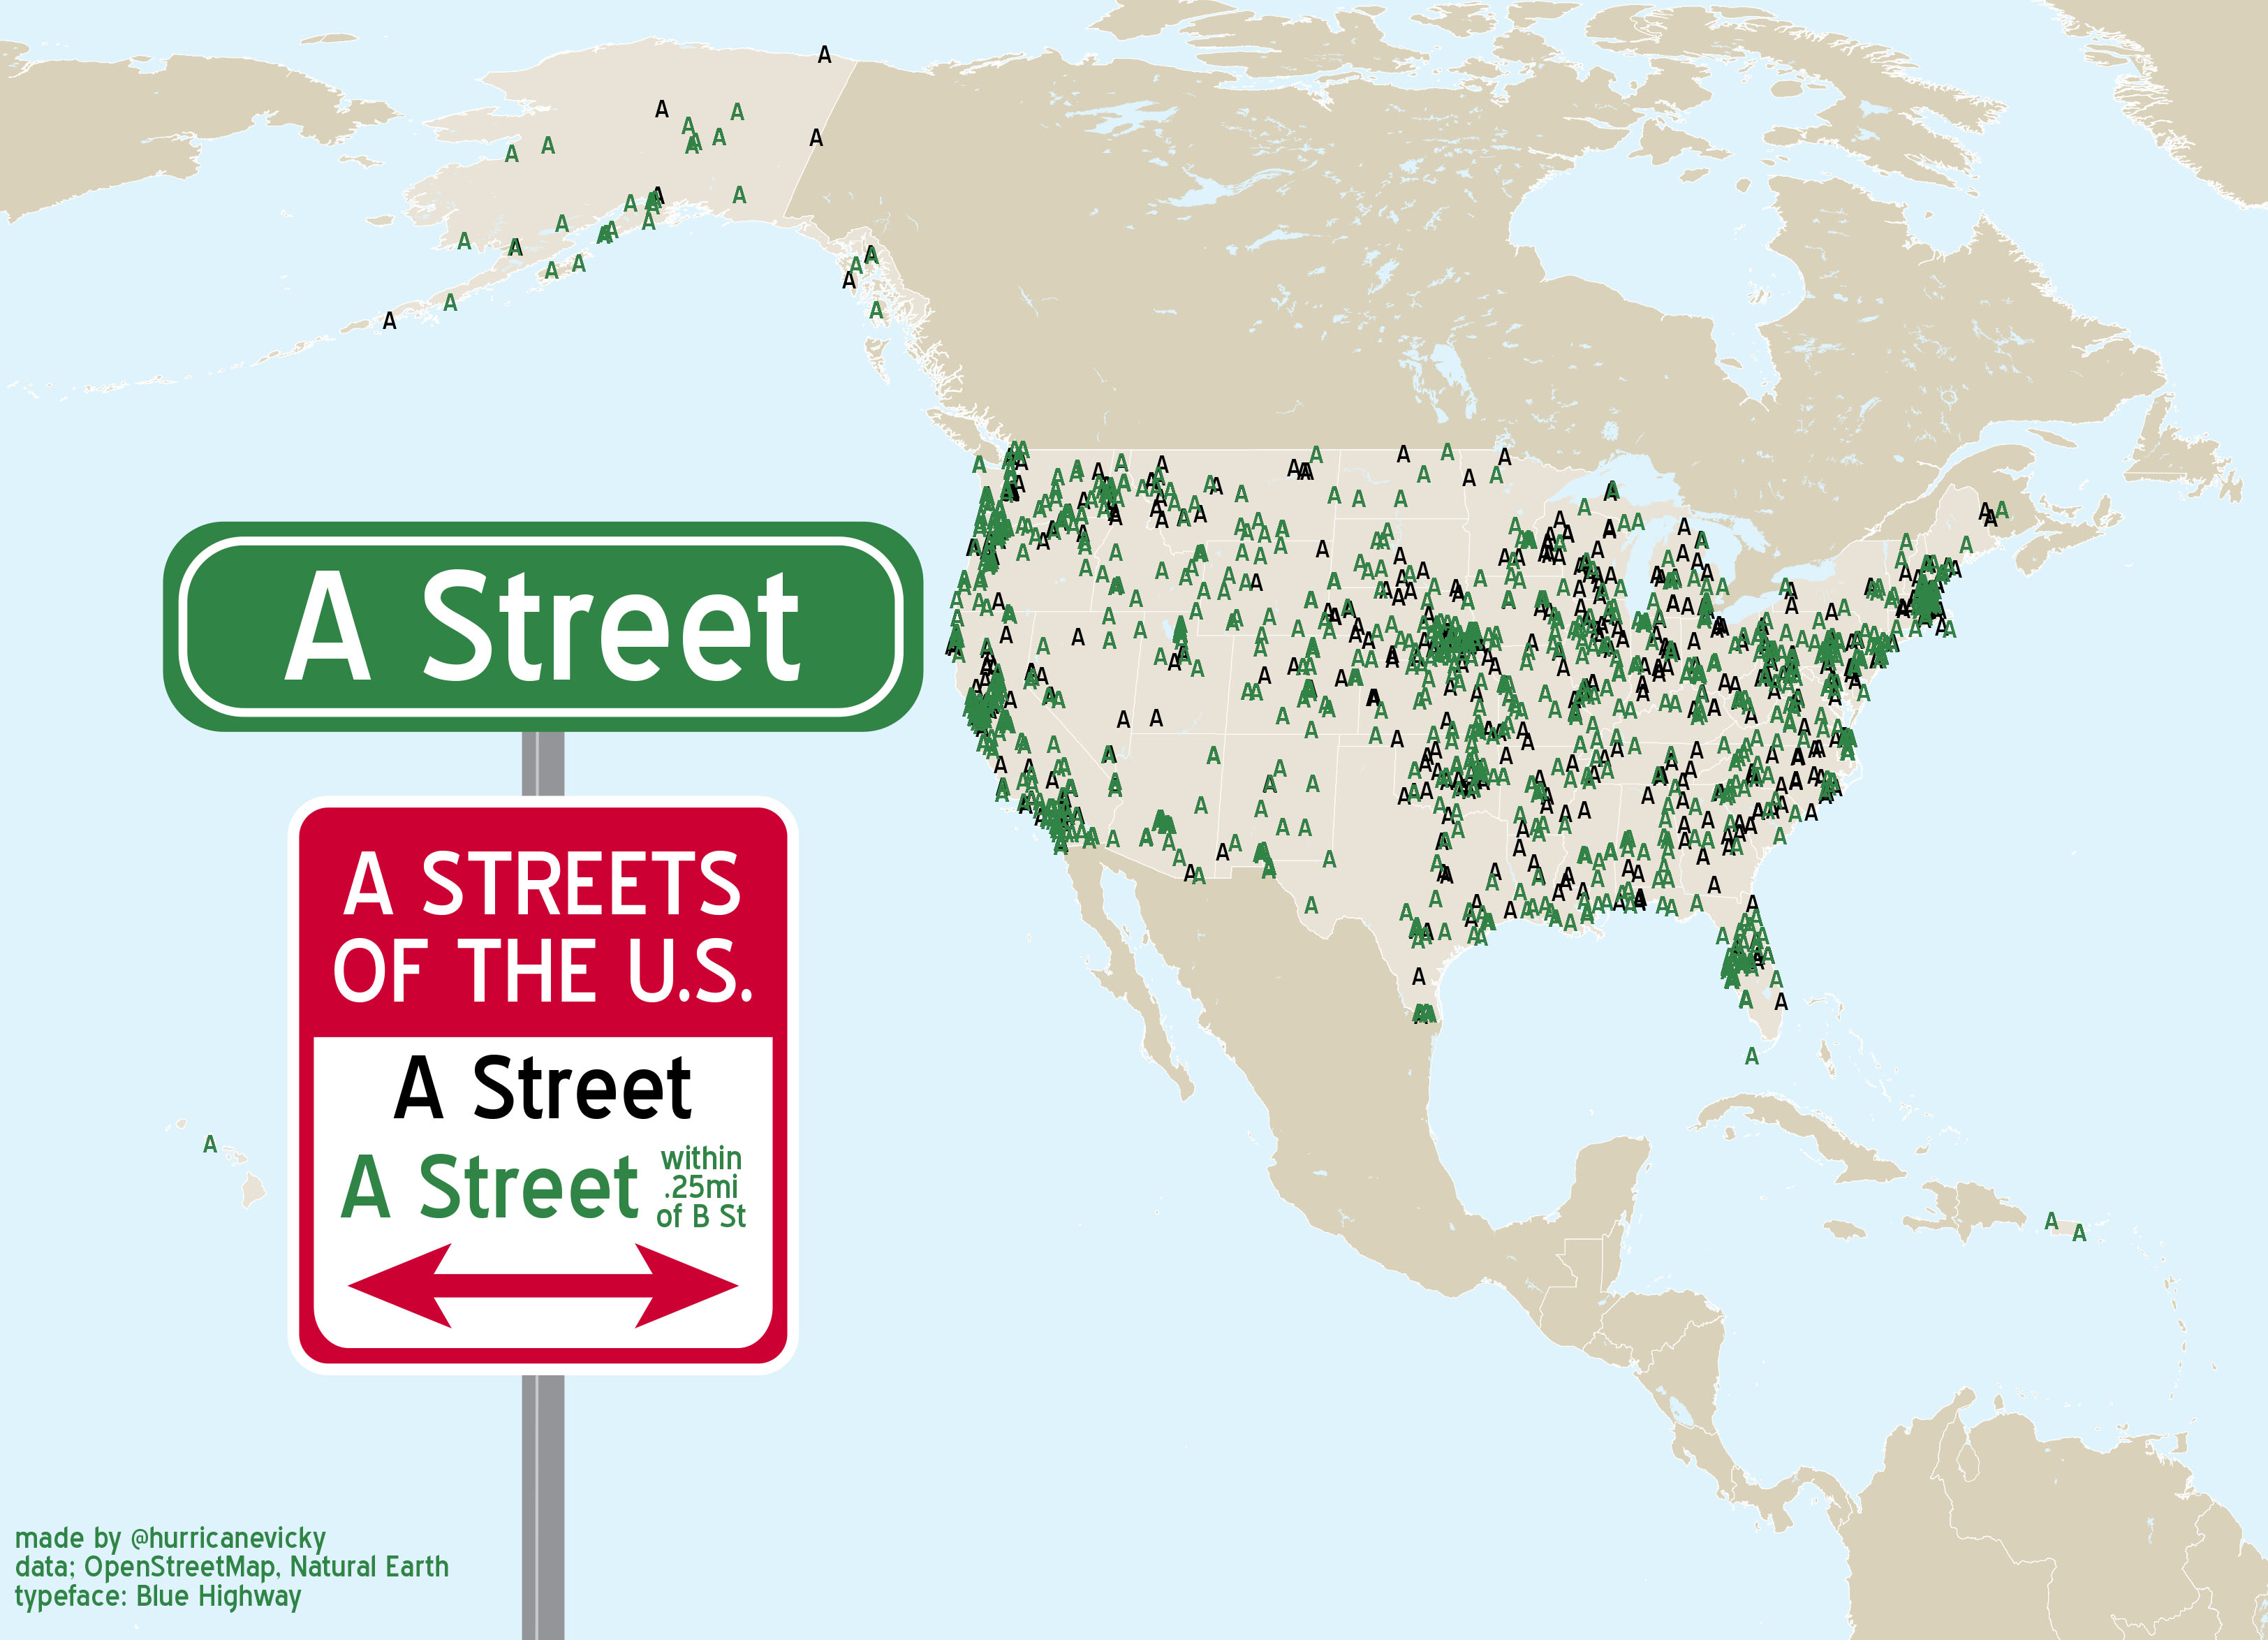 The theme of “a map” can go…anywhere. It’s a very open prompt; I went for a literal interpretation. This map was inspired by one of the regular drives Taylor and I take when we visit his family in Florida and the comment he reliably makes when we pass this sign: “hey! a street!” There are at least two A Streets in DC as well, North and South of the East Capitol Street. How many A Street segments are there? Turns out: many. Naturally, I wondered how many of these A Streets are within a quarter mile of a segment of B Street. But what is the story about the A Streets that aren’t near a B St? Less instantly mappable but I am curious. Perhaps next year.
Alternate approach, just enjoy being screamed at by this map.
Data from the OpenStreetMap via Overpass Turbo and Natural Earth. Typeface is Blue Highway.
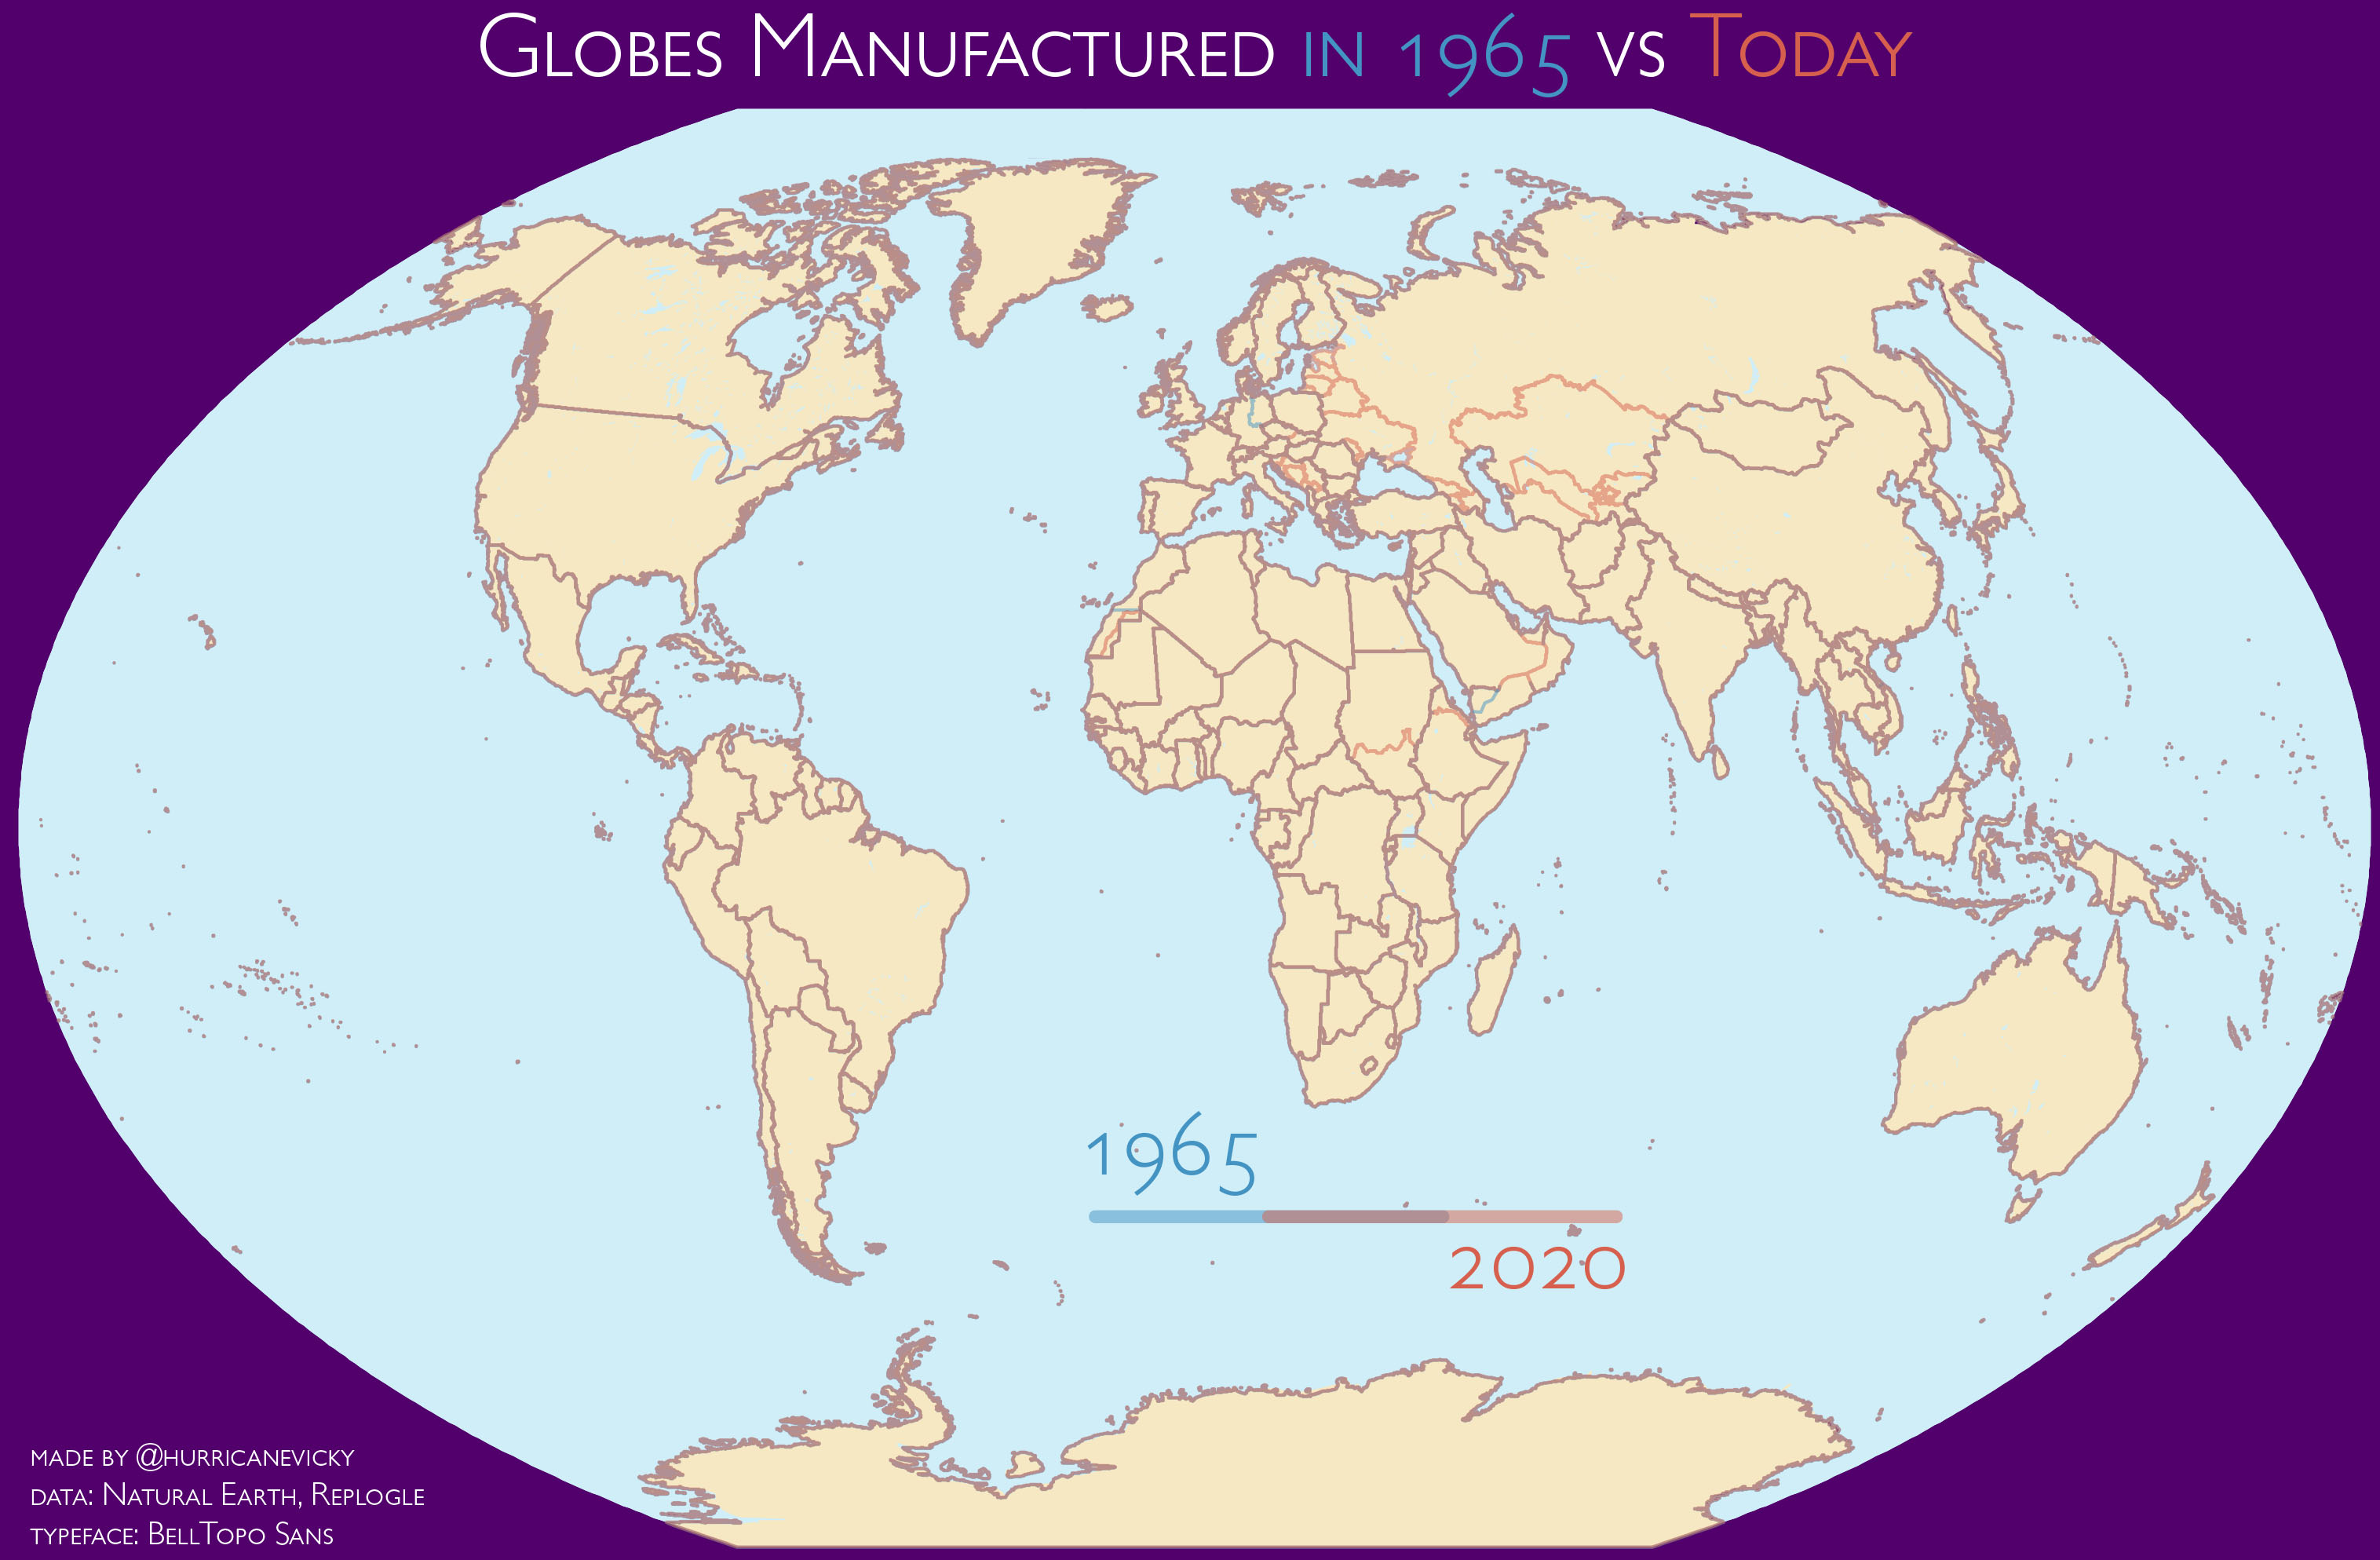
November 29: Globe
 Hands down the map I spent the least amount of time on right here. I committed to doing this challenge every day and it’s really only possible because of this perpetual state of quarantine but I am ready to get my evenings back (if you are just tuning in now, sorry, scroll down for better maps).
I am the proud owner of a 1965 Replogle globe, it haunts the top of a bookcase and looks handsome collecting dust (if this sounds familiar…I did write an awl piece in 2011 about getting drunk and buying it). Thoroughly uninterested in giving up any more of my Sunday than strictly necessary I pulled the globe down and mapped differences to borders between 1965 and 2020. They can’t all be winners.
Data from the Replogle globe and Natural Earth. Typeface is BellTopo Sans.
November 28: Non-Geographic Map
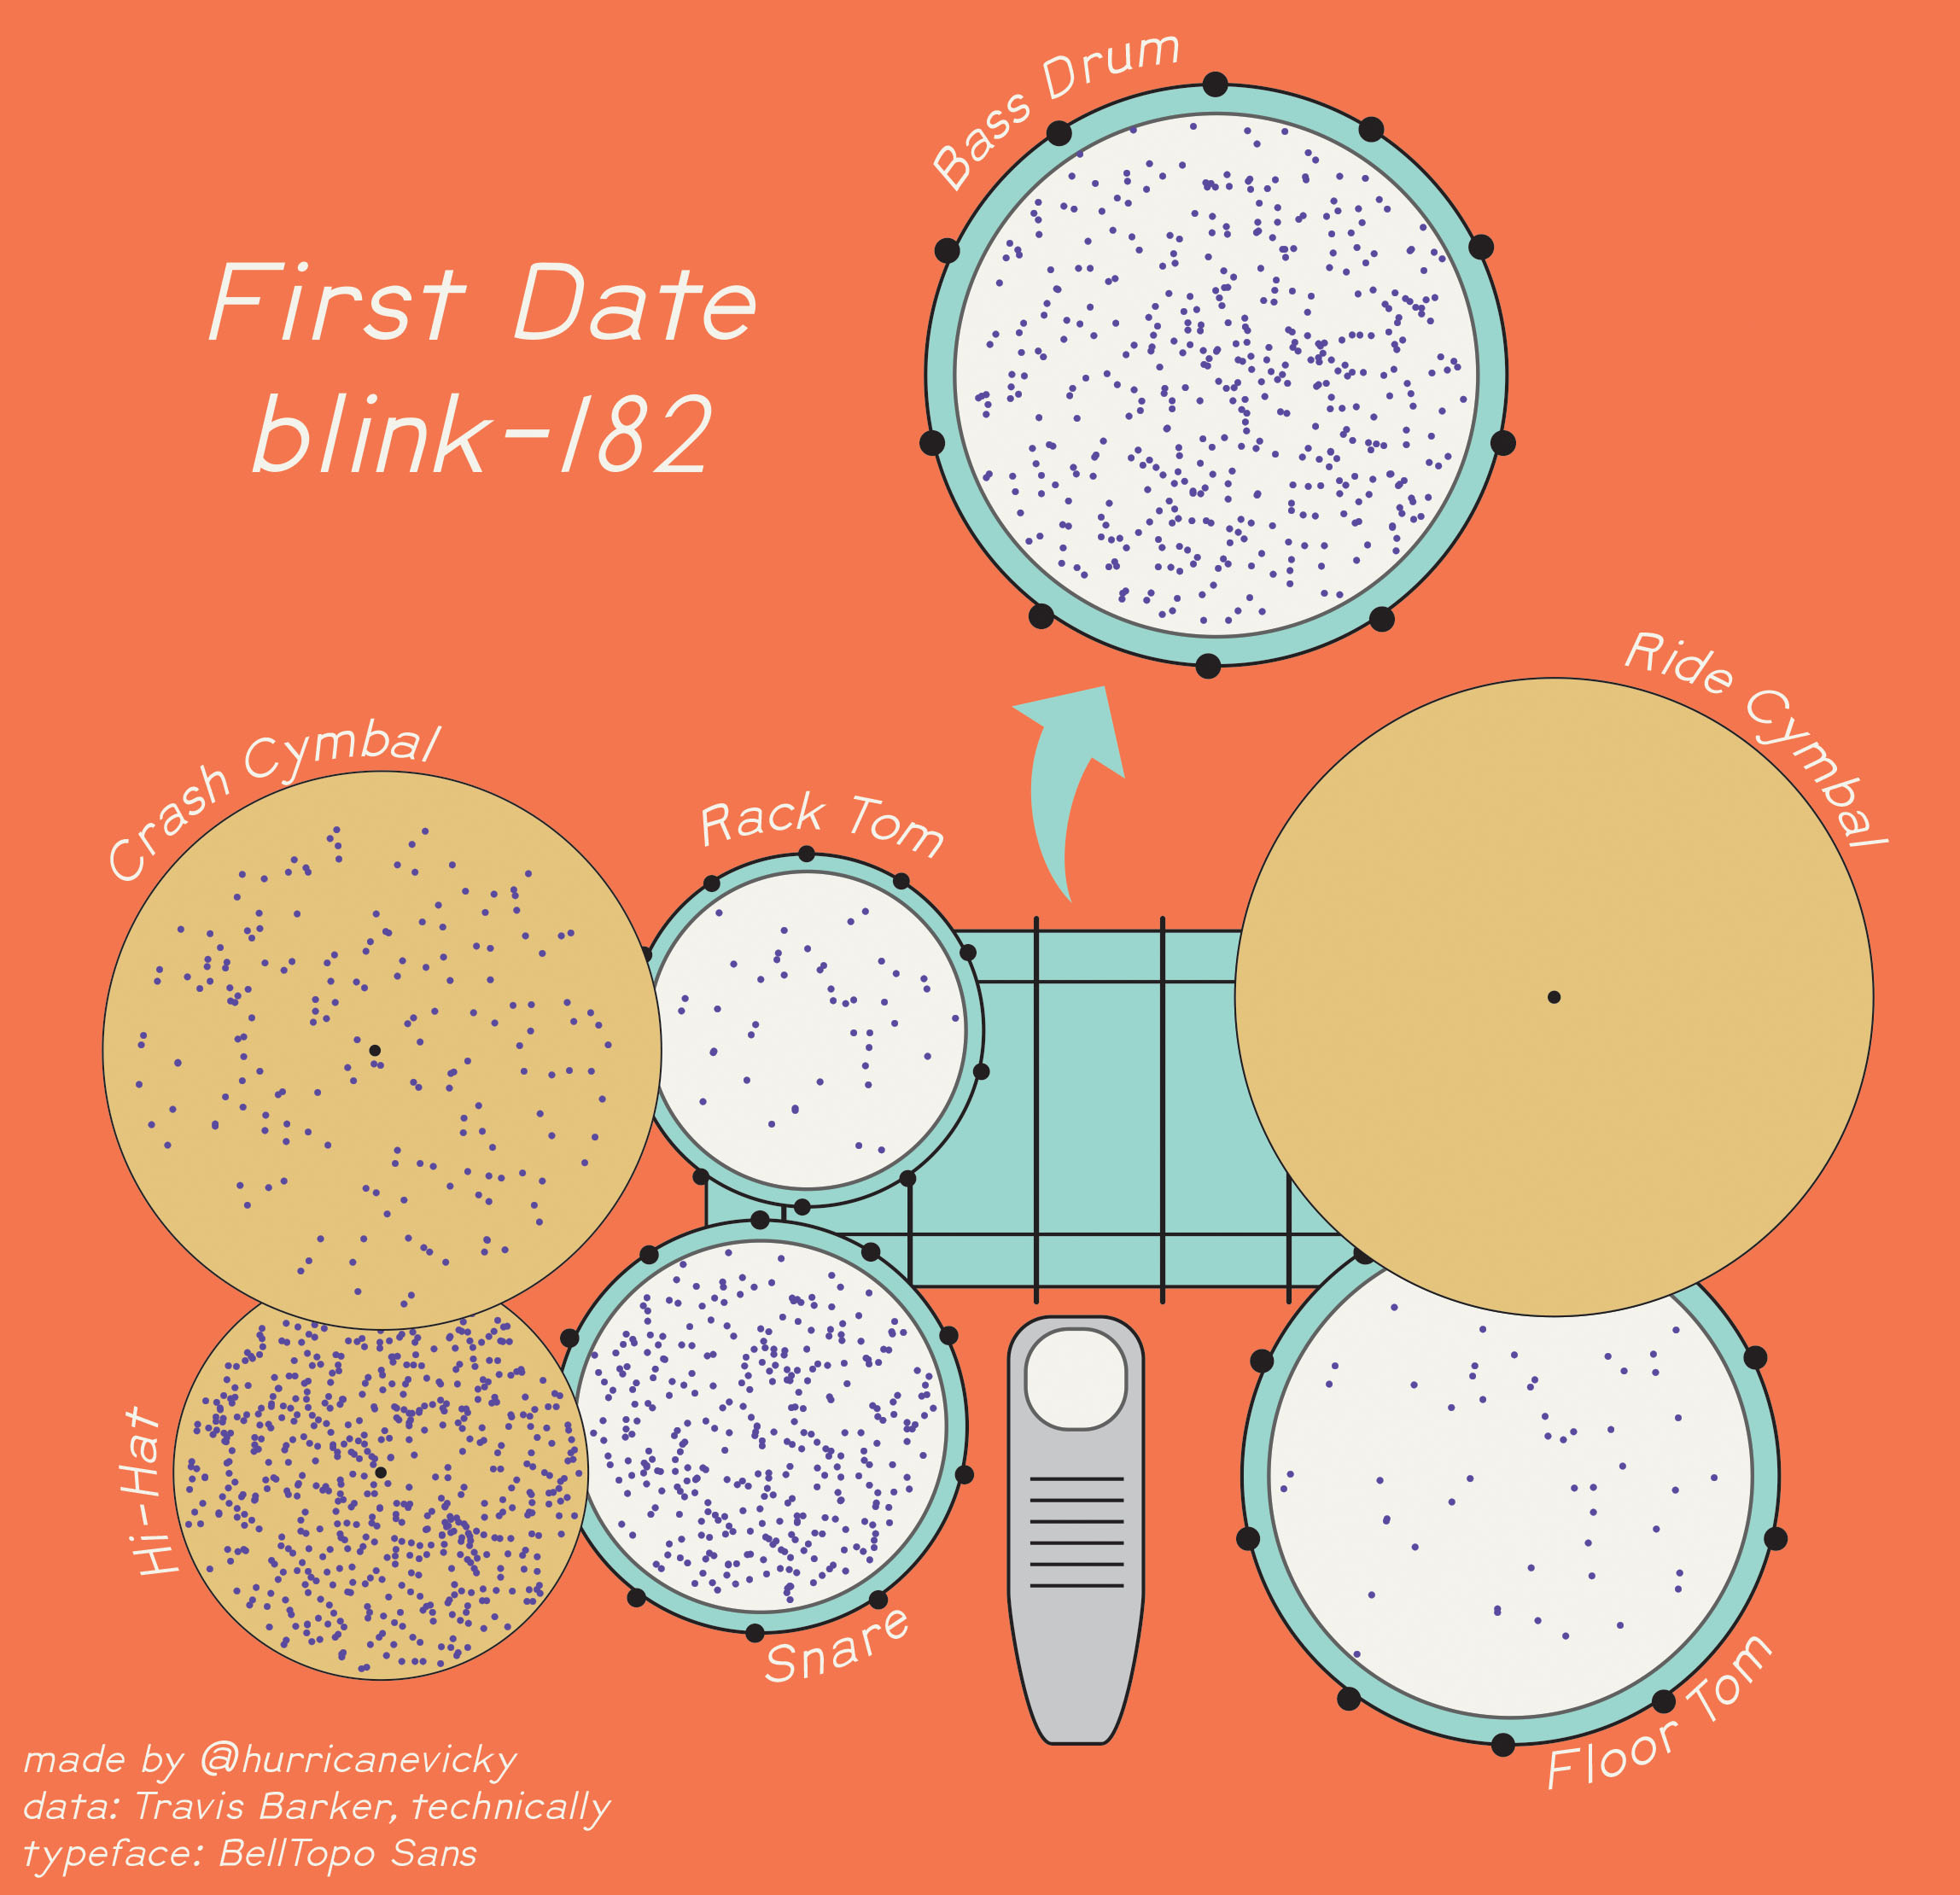 In February - I can’t believe it was this year - Lindsey, Taylor, and I played a set of blink-182 covers in a benefit show for HIPS DC. It was exhilirating, and not just becase the Ramones band’s bass player walked out and disappeared into the night in the middle of a song. I miss seeing and playing live music with my friends but I do not miss the stress of learning four songs from scratch over the too-short weeks leading up to the show! This map is sort of a peek into my memorization process, in that I think about where my hands and feet need to be spatially rather than musically, if that makes sense. It doesn’t make me a great improviser but has made breaking down a song into managable parts something I feel comfortable doing.
Data from Travis Barker. Typeface is BellTopo Sans.
November 27: Big or Small Data
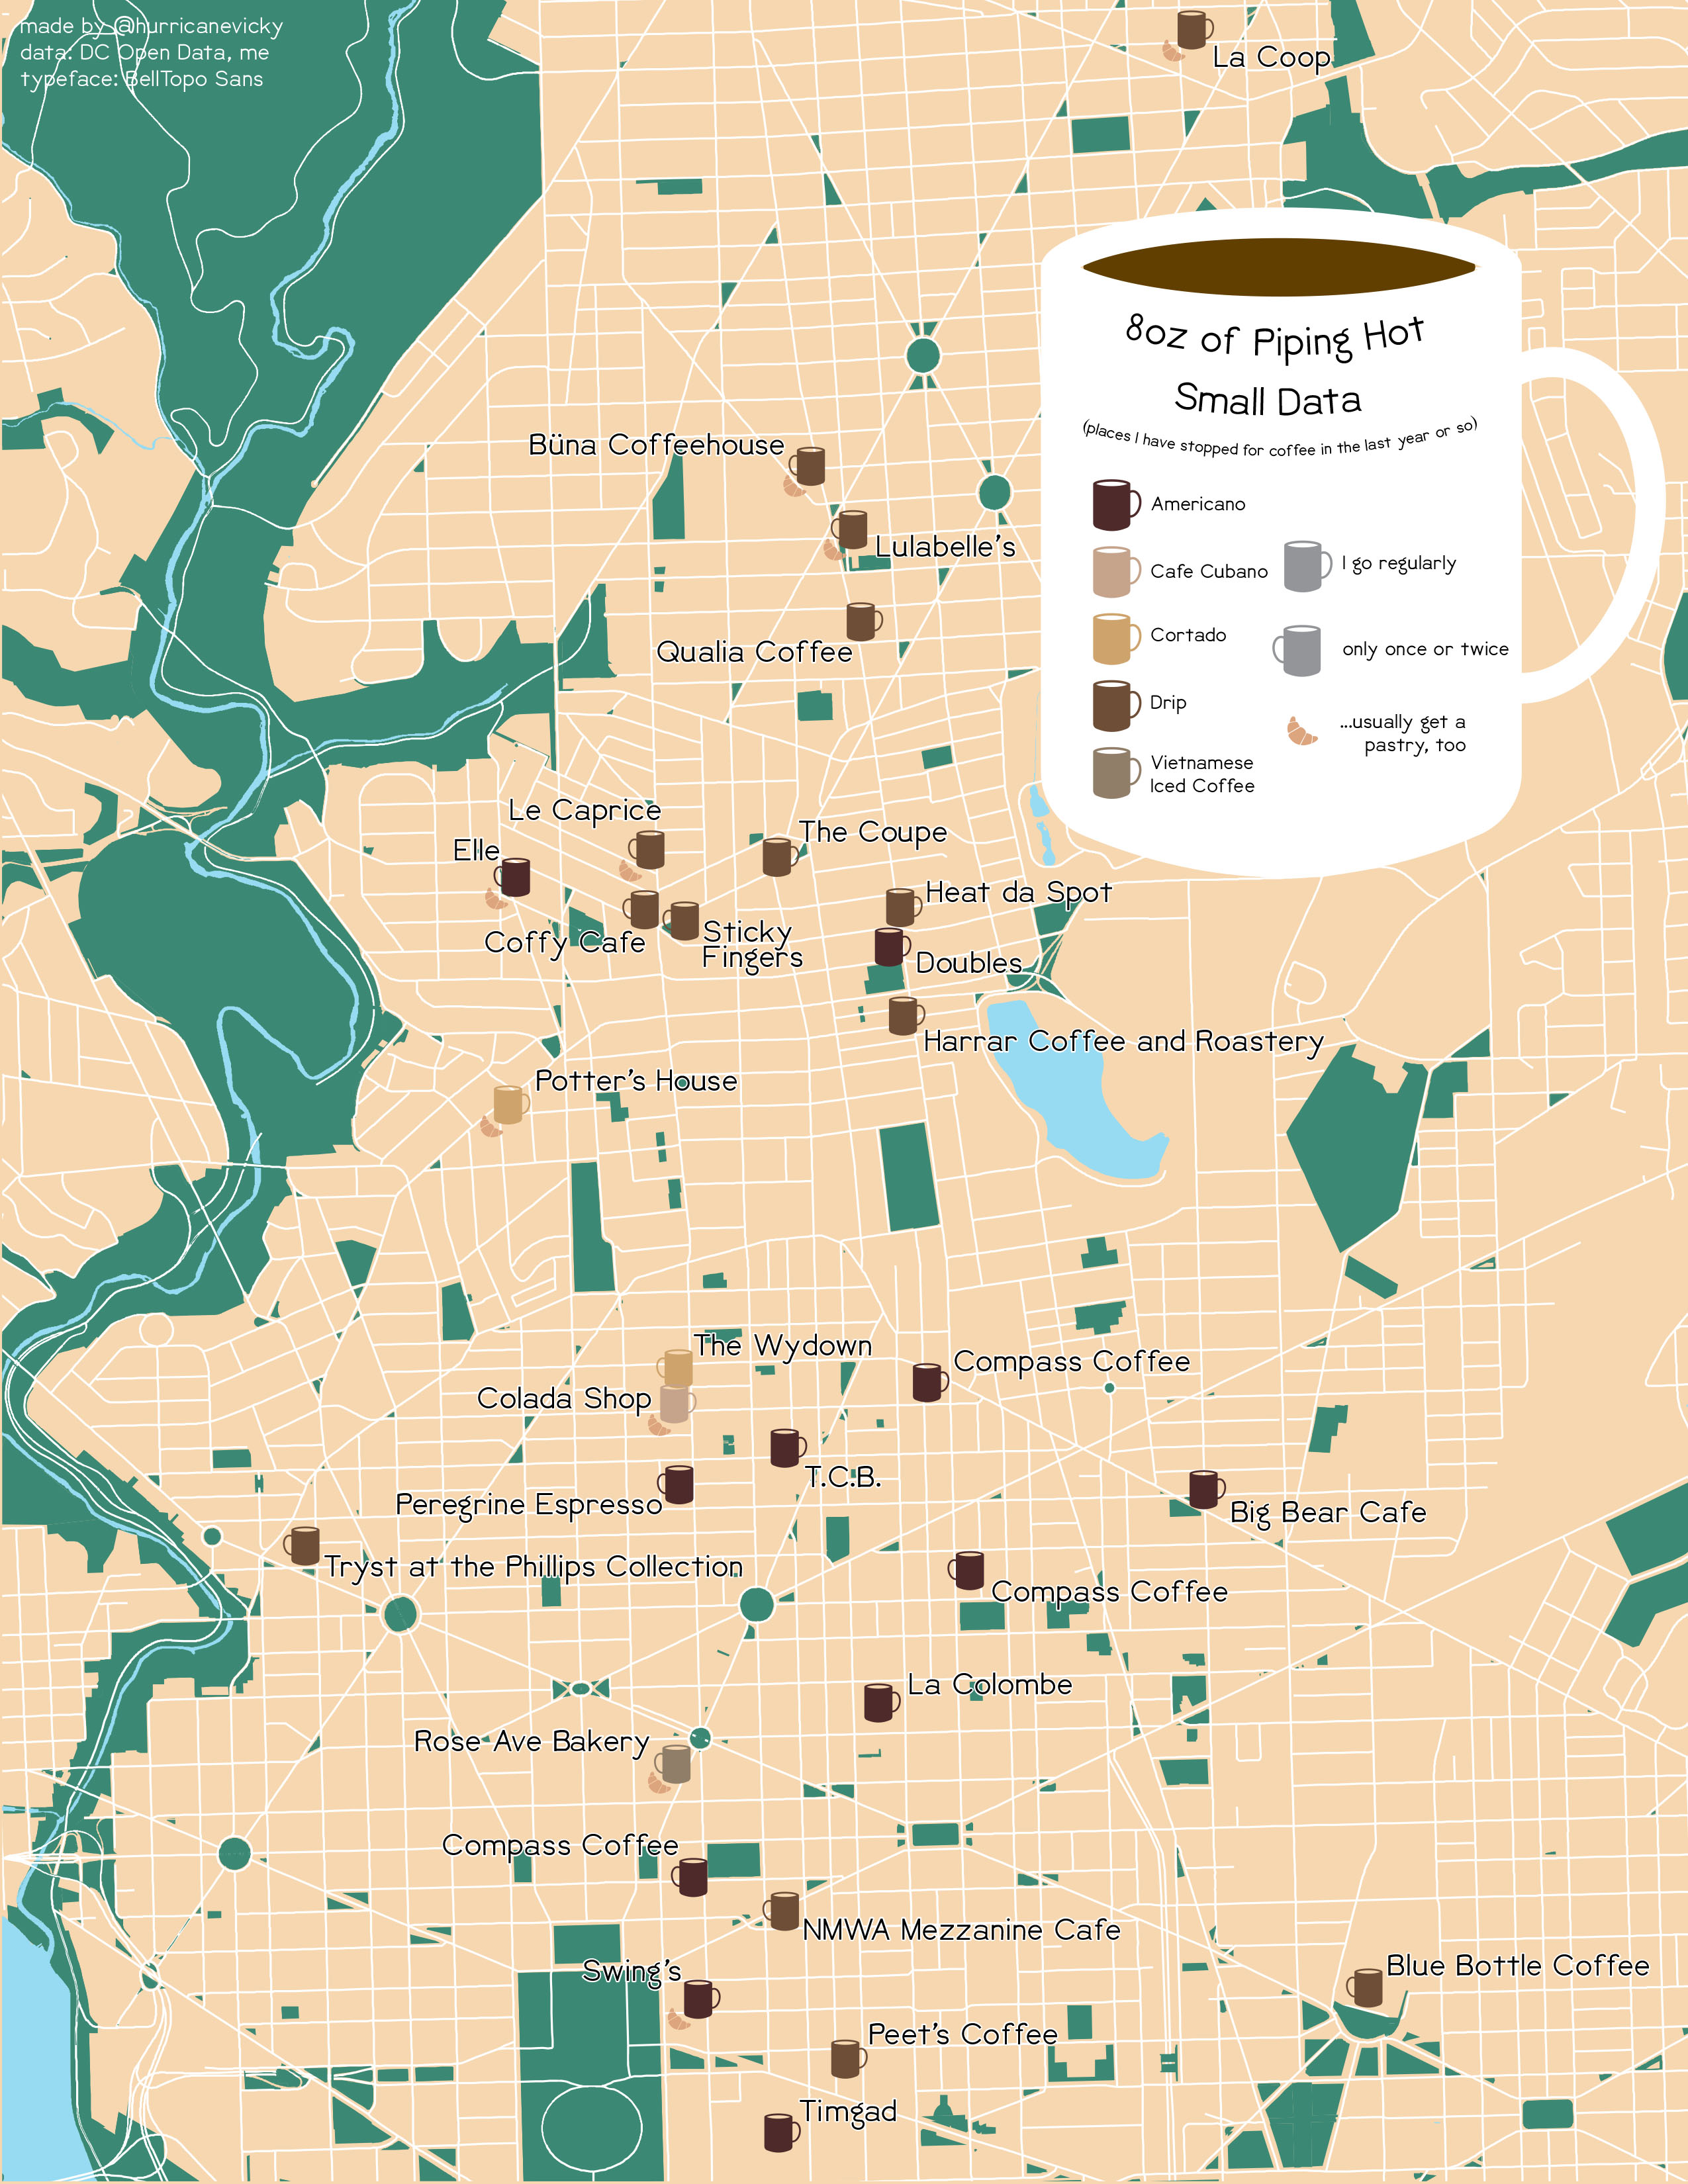 Well obviously I went for small data here, in the form of individual cups of coffee I’ve had over the past year or so. Back when I went to an office I would plot my commute (on foot it’s about three miles, a nice way to start the morning) based on whatever coffee I was feeling that day, so that’s what most of these are. The rest are one- or two-offs, like getting a coffee before hopping on amtrak or stopping in to a museum.
Data from my memory and DC Open Data. Typeface is BellTopo Sans.
November 26: Map with a New Tool
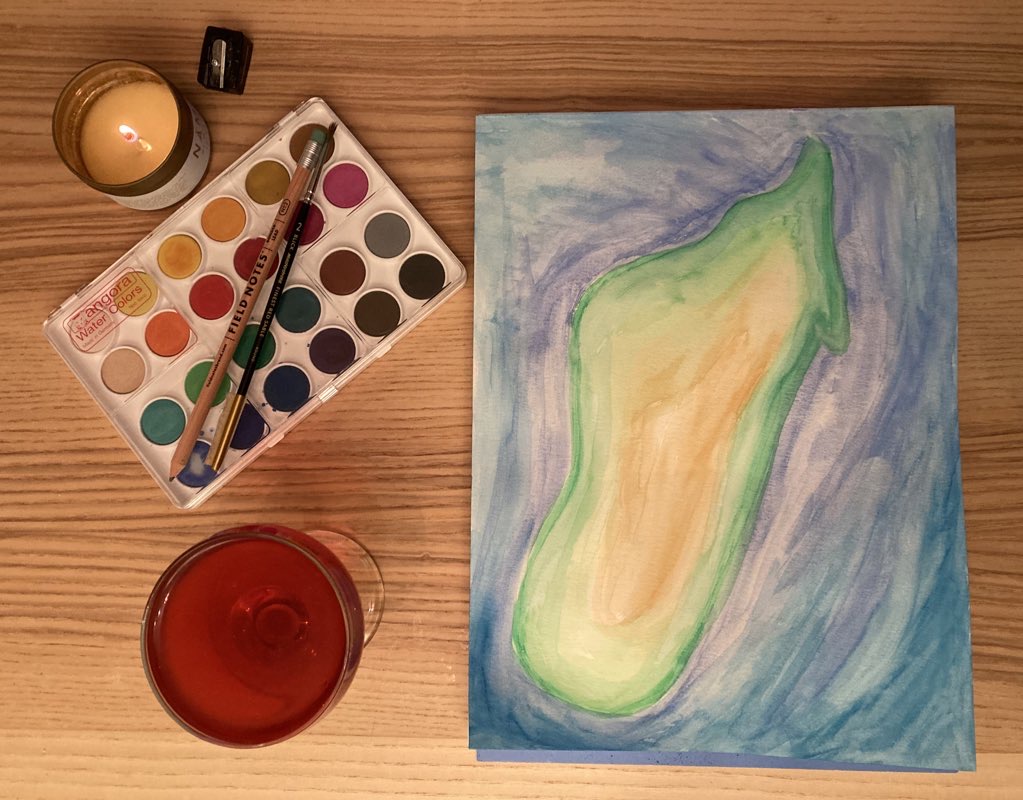 It’s Thanksgiving, and fortunately I had a new tool I could try without turning my computer on. Watercolors are not technically a new-new tool for me, but the only other page on the watercolor pad with anything on it holds a painting of a hoagie. My skill level should make it clear, it’s new enough that I’m not any good at it.
Drink is a cranberry negroni.
November 25: COVID-19
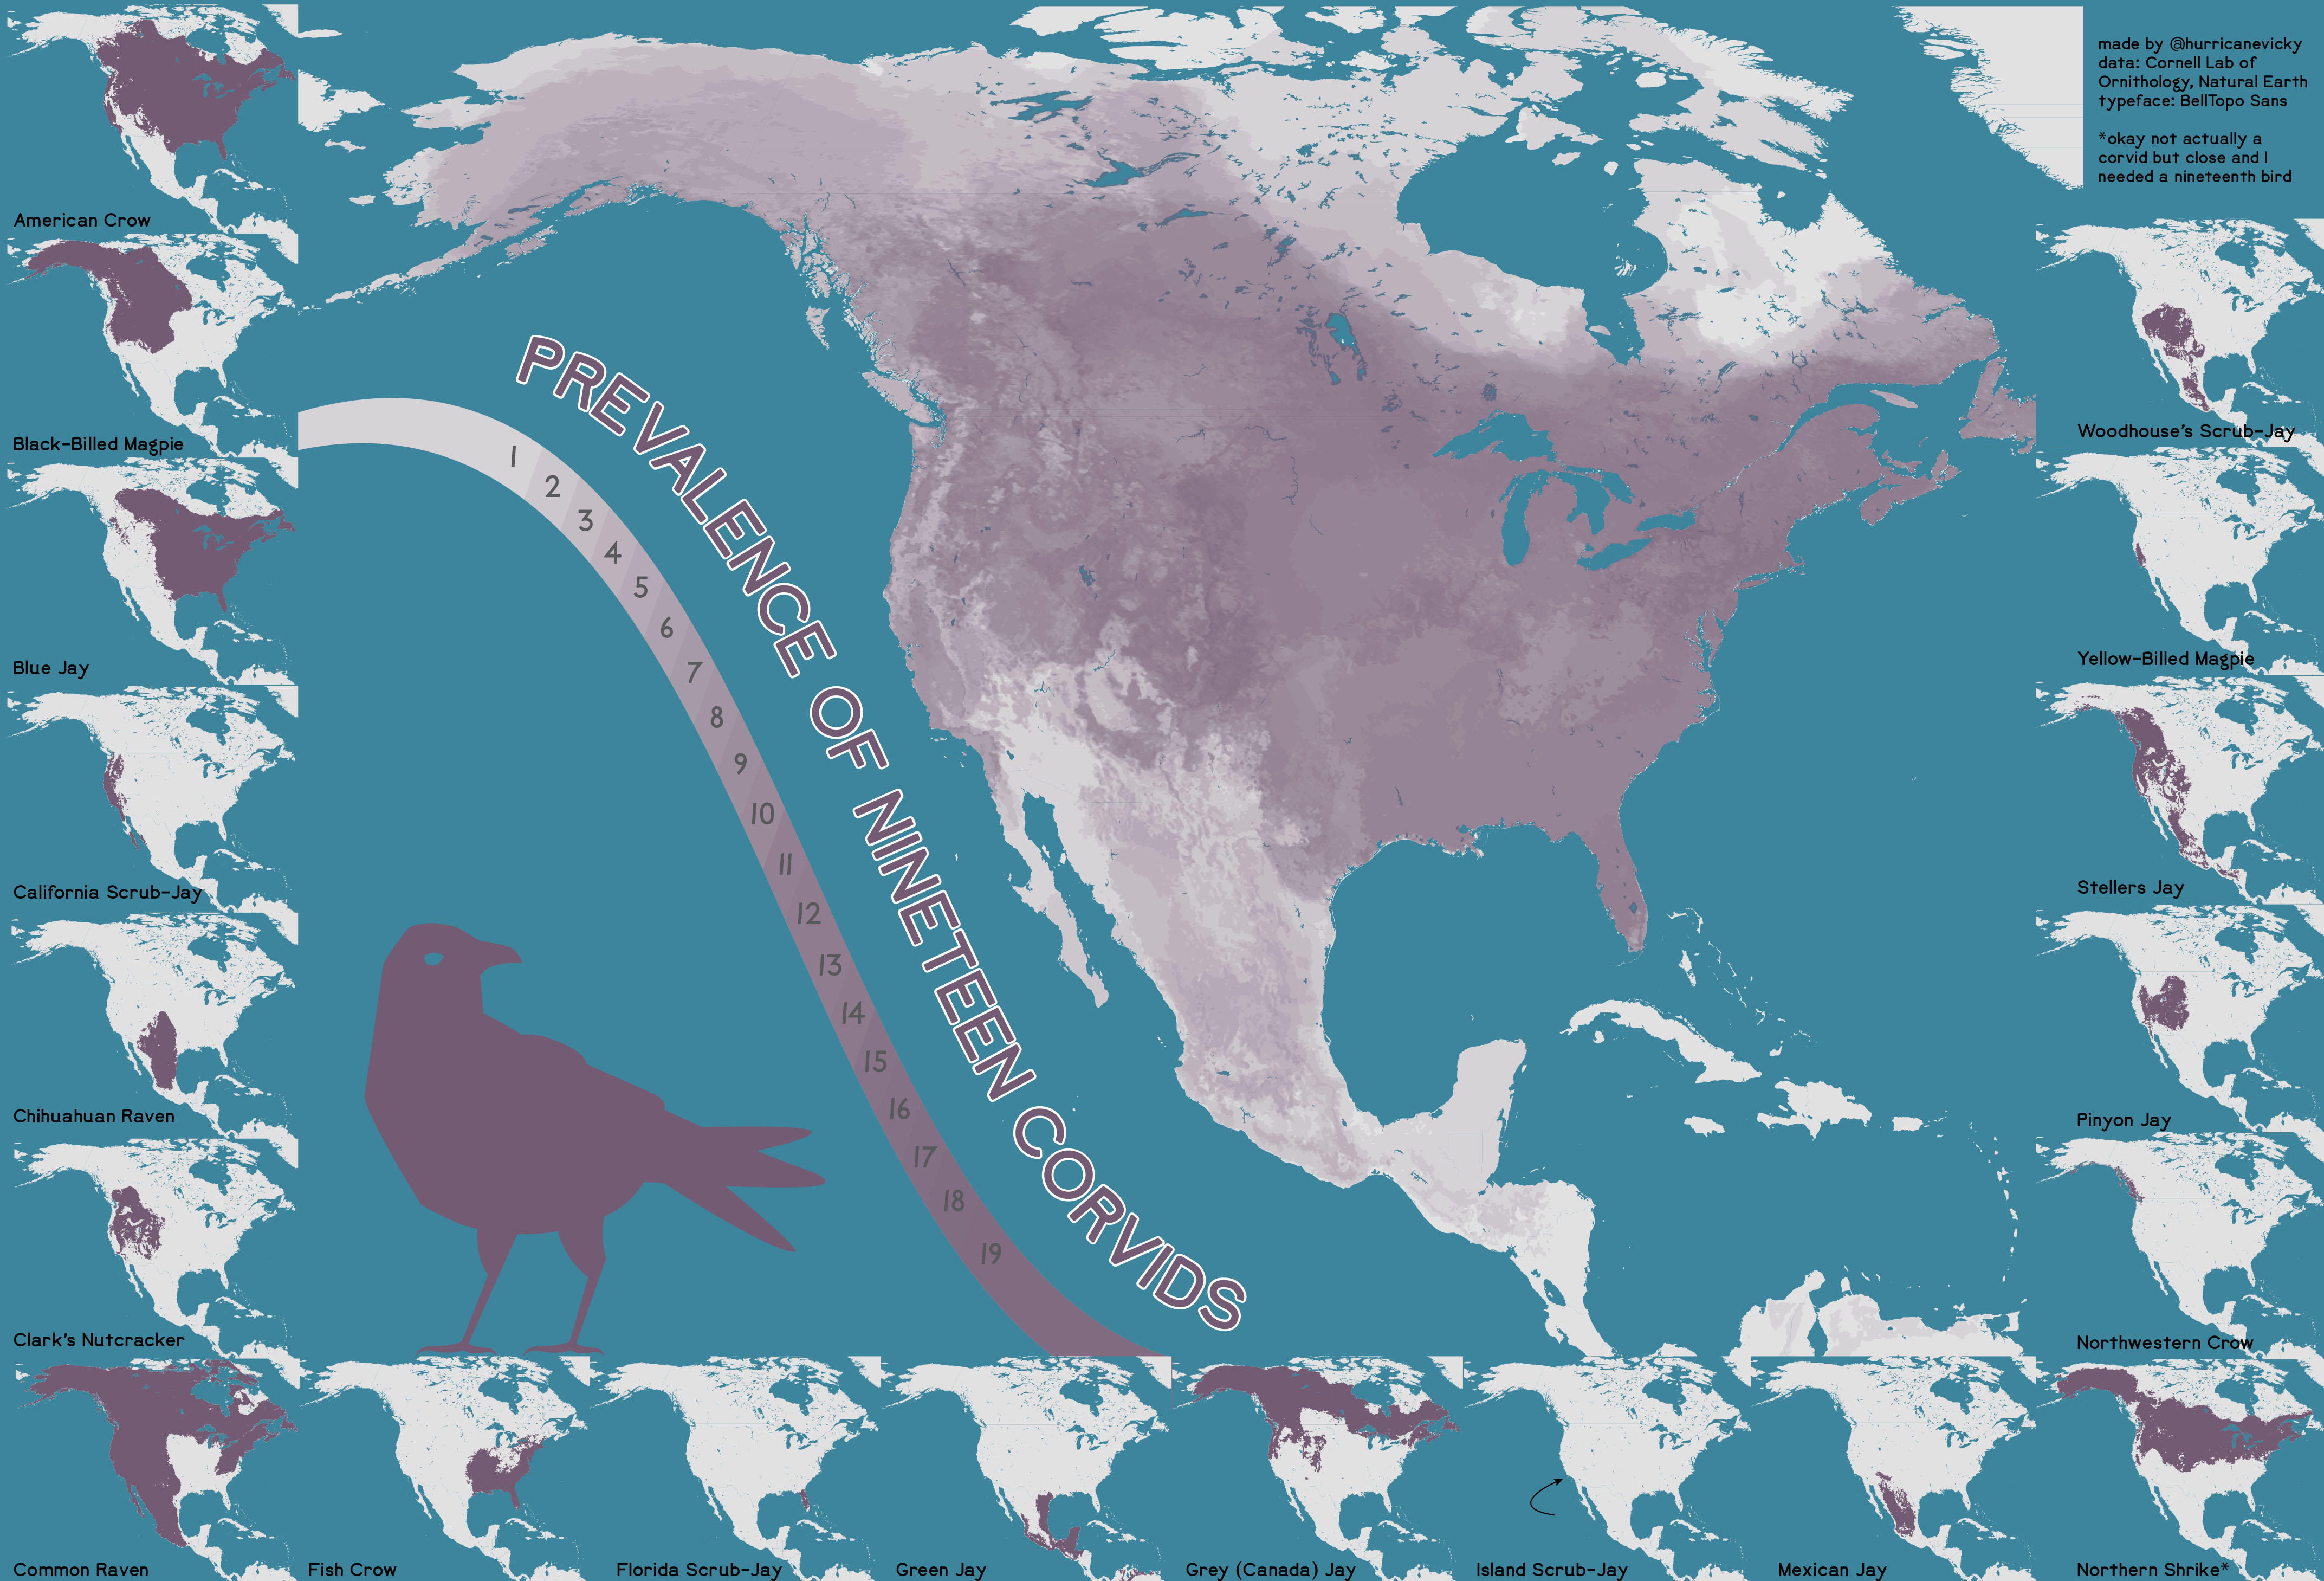 Theme is Corvid 19? Did I read that right?
Actually rather proud of how well this dumb joke turned out. I’ve done a bunch of COVID-19 mapping at work this year. I have not done nearly as much dumb joke mapping.
Data from Cornell Lab of Ornithology, which only had 18 corvids so I threw in a shrike as well (close enough) and Natural Earth. Typeface is BellTopo Sans.
November 24: Elevation
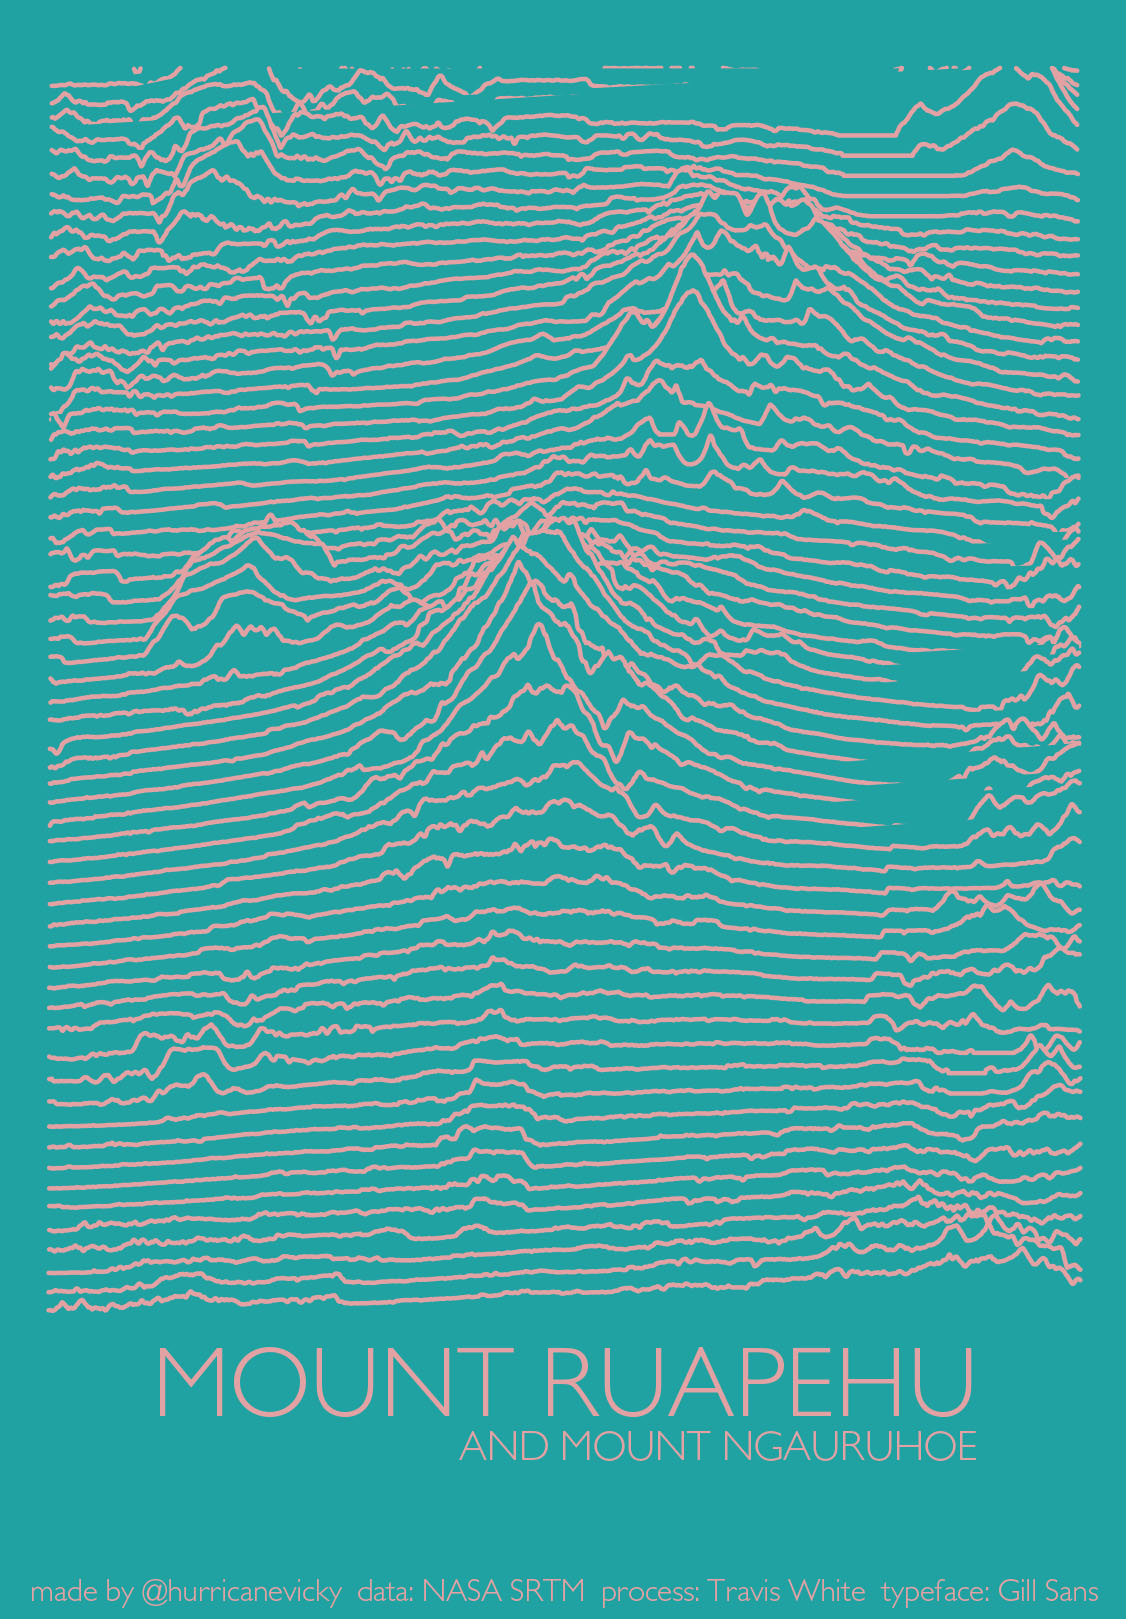 Travis White is an adroit cartographer and researcher. He’s brilliantly creative, but also just very funny and lively and an excellent speaker, so his NACIS talks are always must-attend sessions for me. At NACIS 2018 (Norfolk) he gave a talk called Cartographic Pleasures on Joy Division’s 1979 album Unknown Pleasures as inspiration for terrain transect maps, and that concept has been stuck in the back of my mind as something I wanted to try. Helpfully, he also wrote up a very easy to follow tutorial in Cartographic Perspectives, which is how I made this one. I chose Mt Ruapehu as the terrain, I skiied there once when I lived in Auckland and rather like its shape. Probably the only active volcano I will ever ski I reckon. Truly cannot tell you why I styled it to look like some hotel art from the 1980s.
Data from NASA SRTM. Typeface is Gill Sans.
November 23: Boundaries
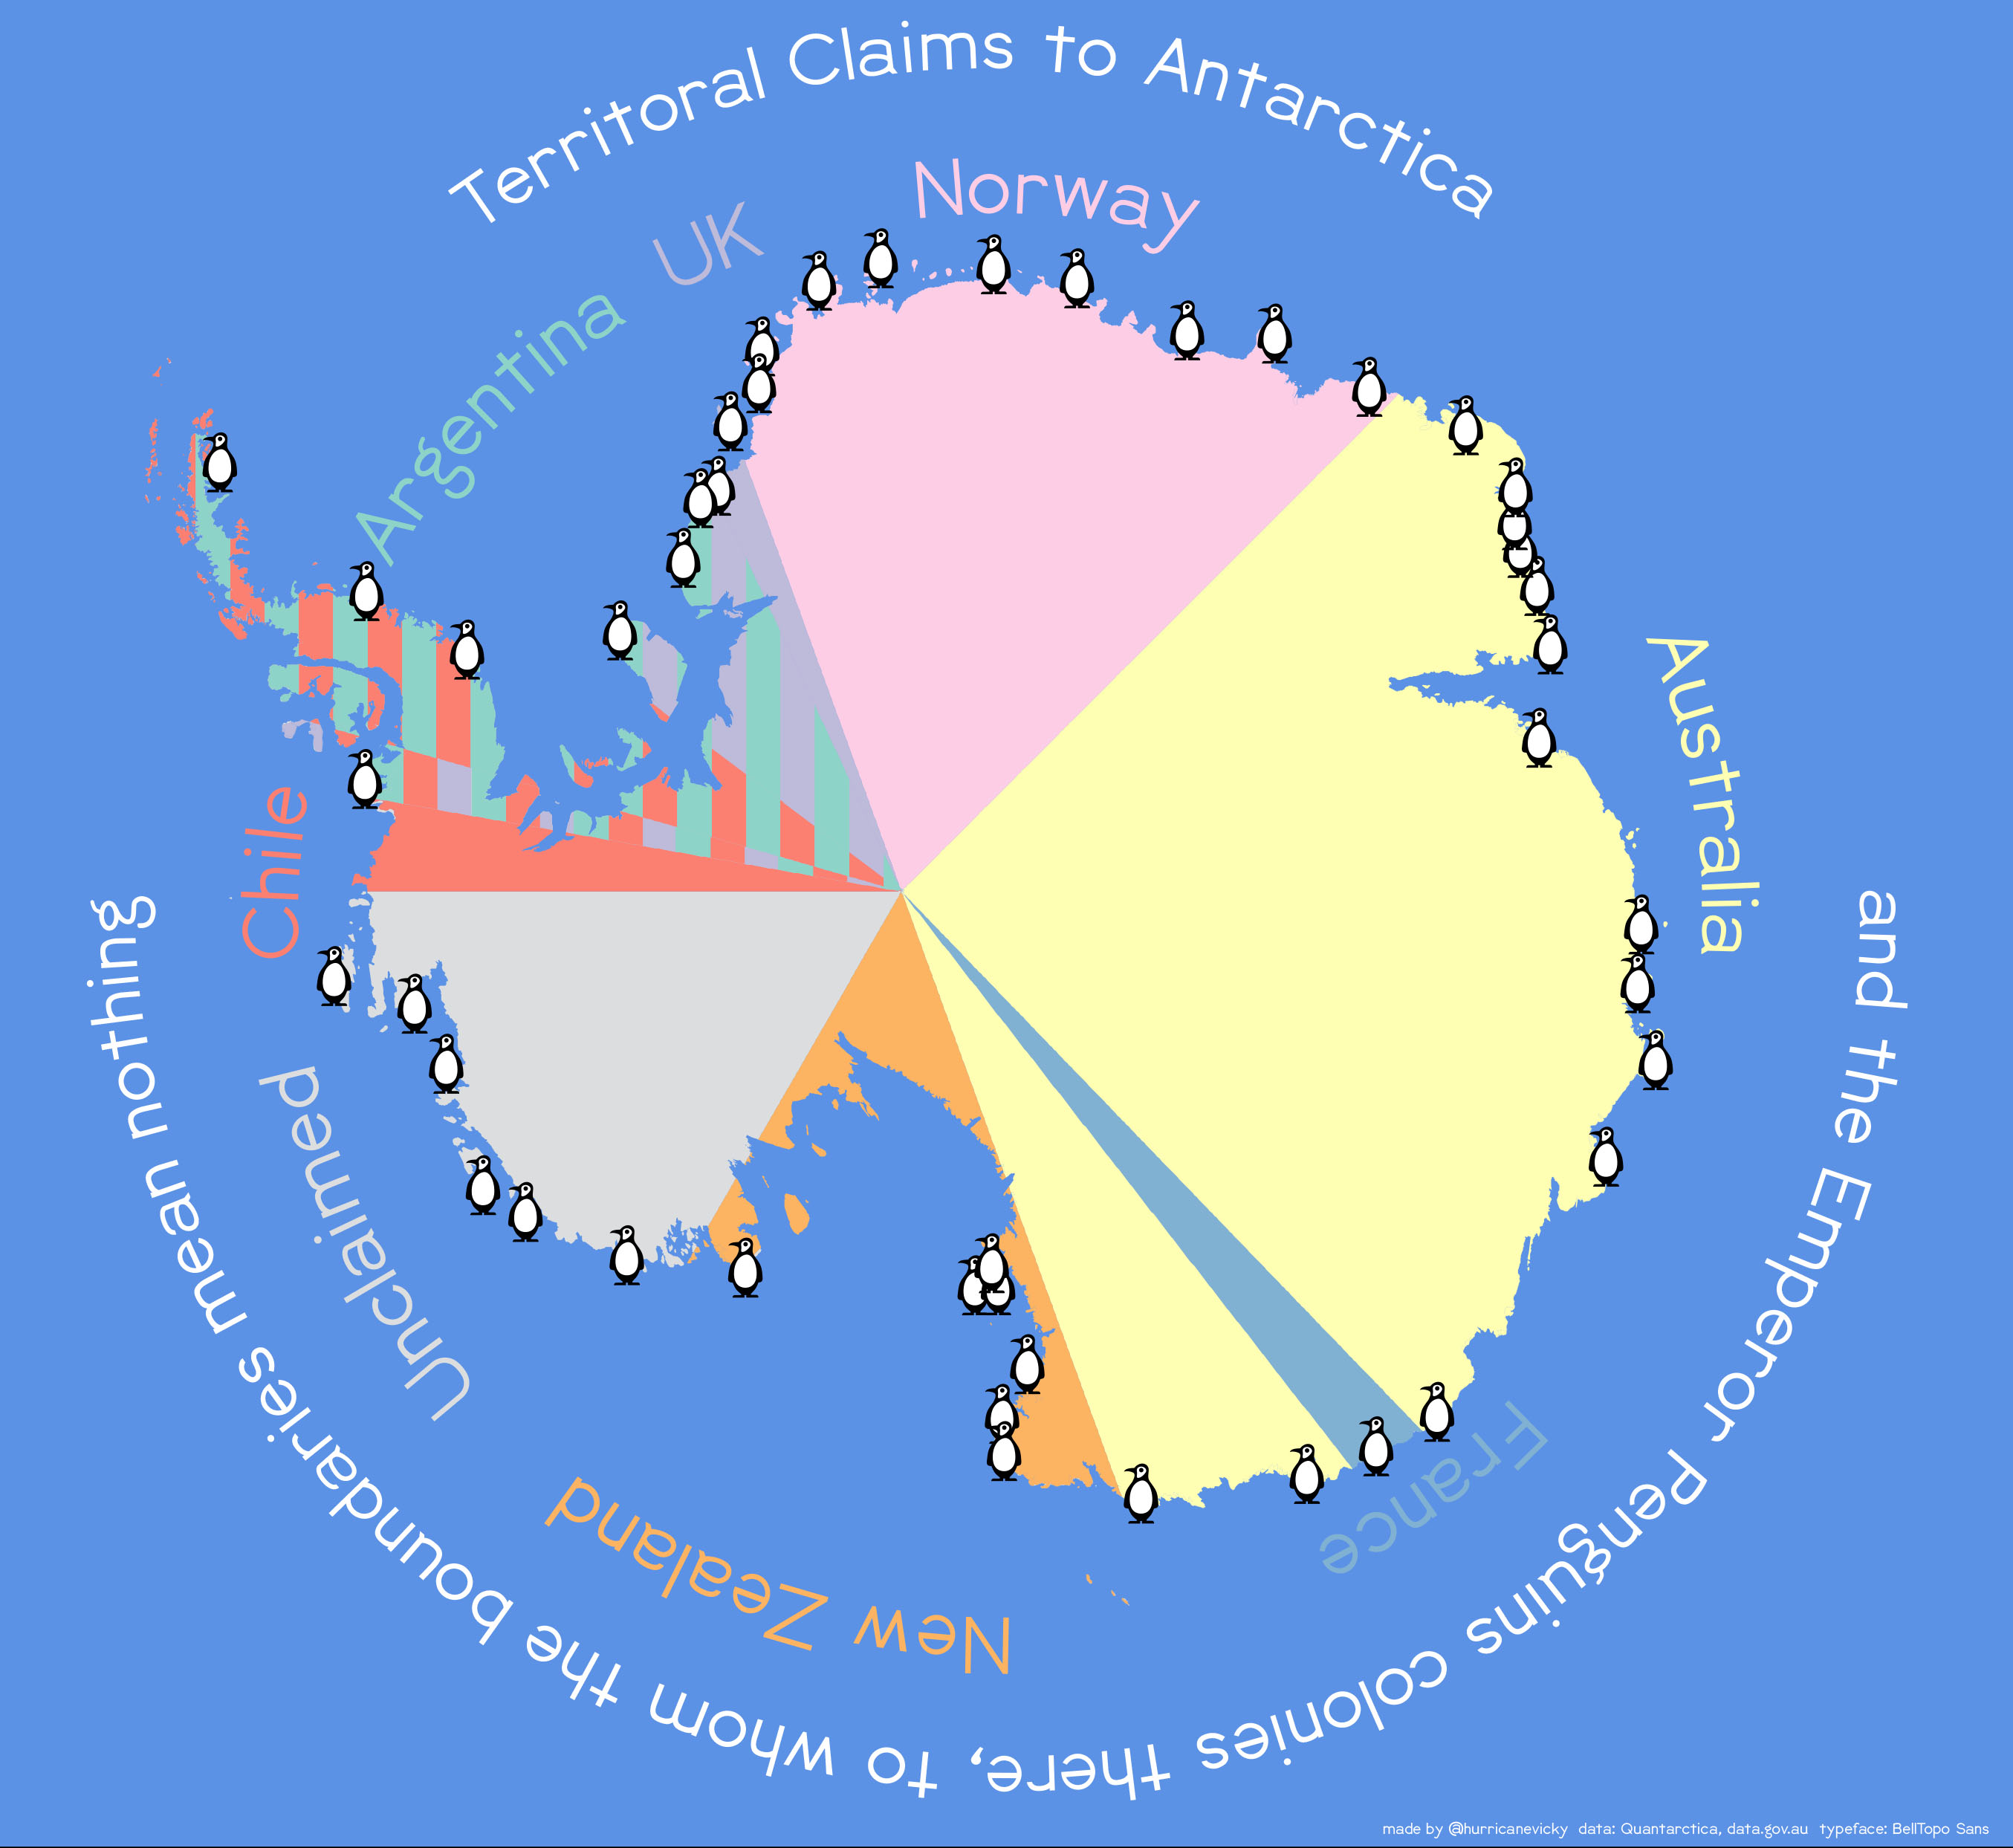 The main takeaway from this one is that the Norsk Polarinstitutt operates a free data platform called QUANTARCTICA.
Data from data.gov.au and Quantarctica. Typeface is BellTopo Sans.
November 22: Movement
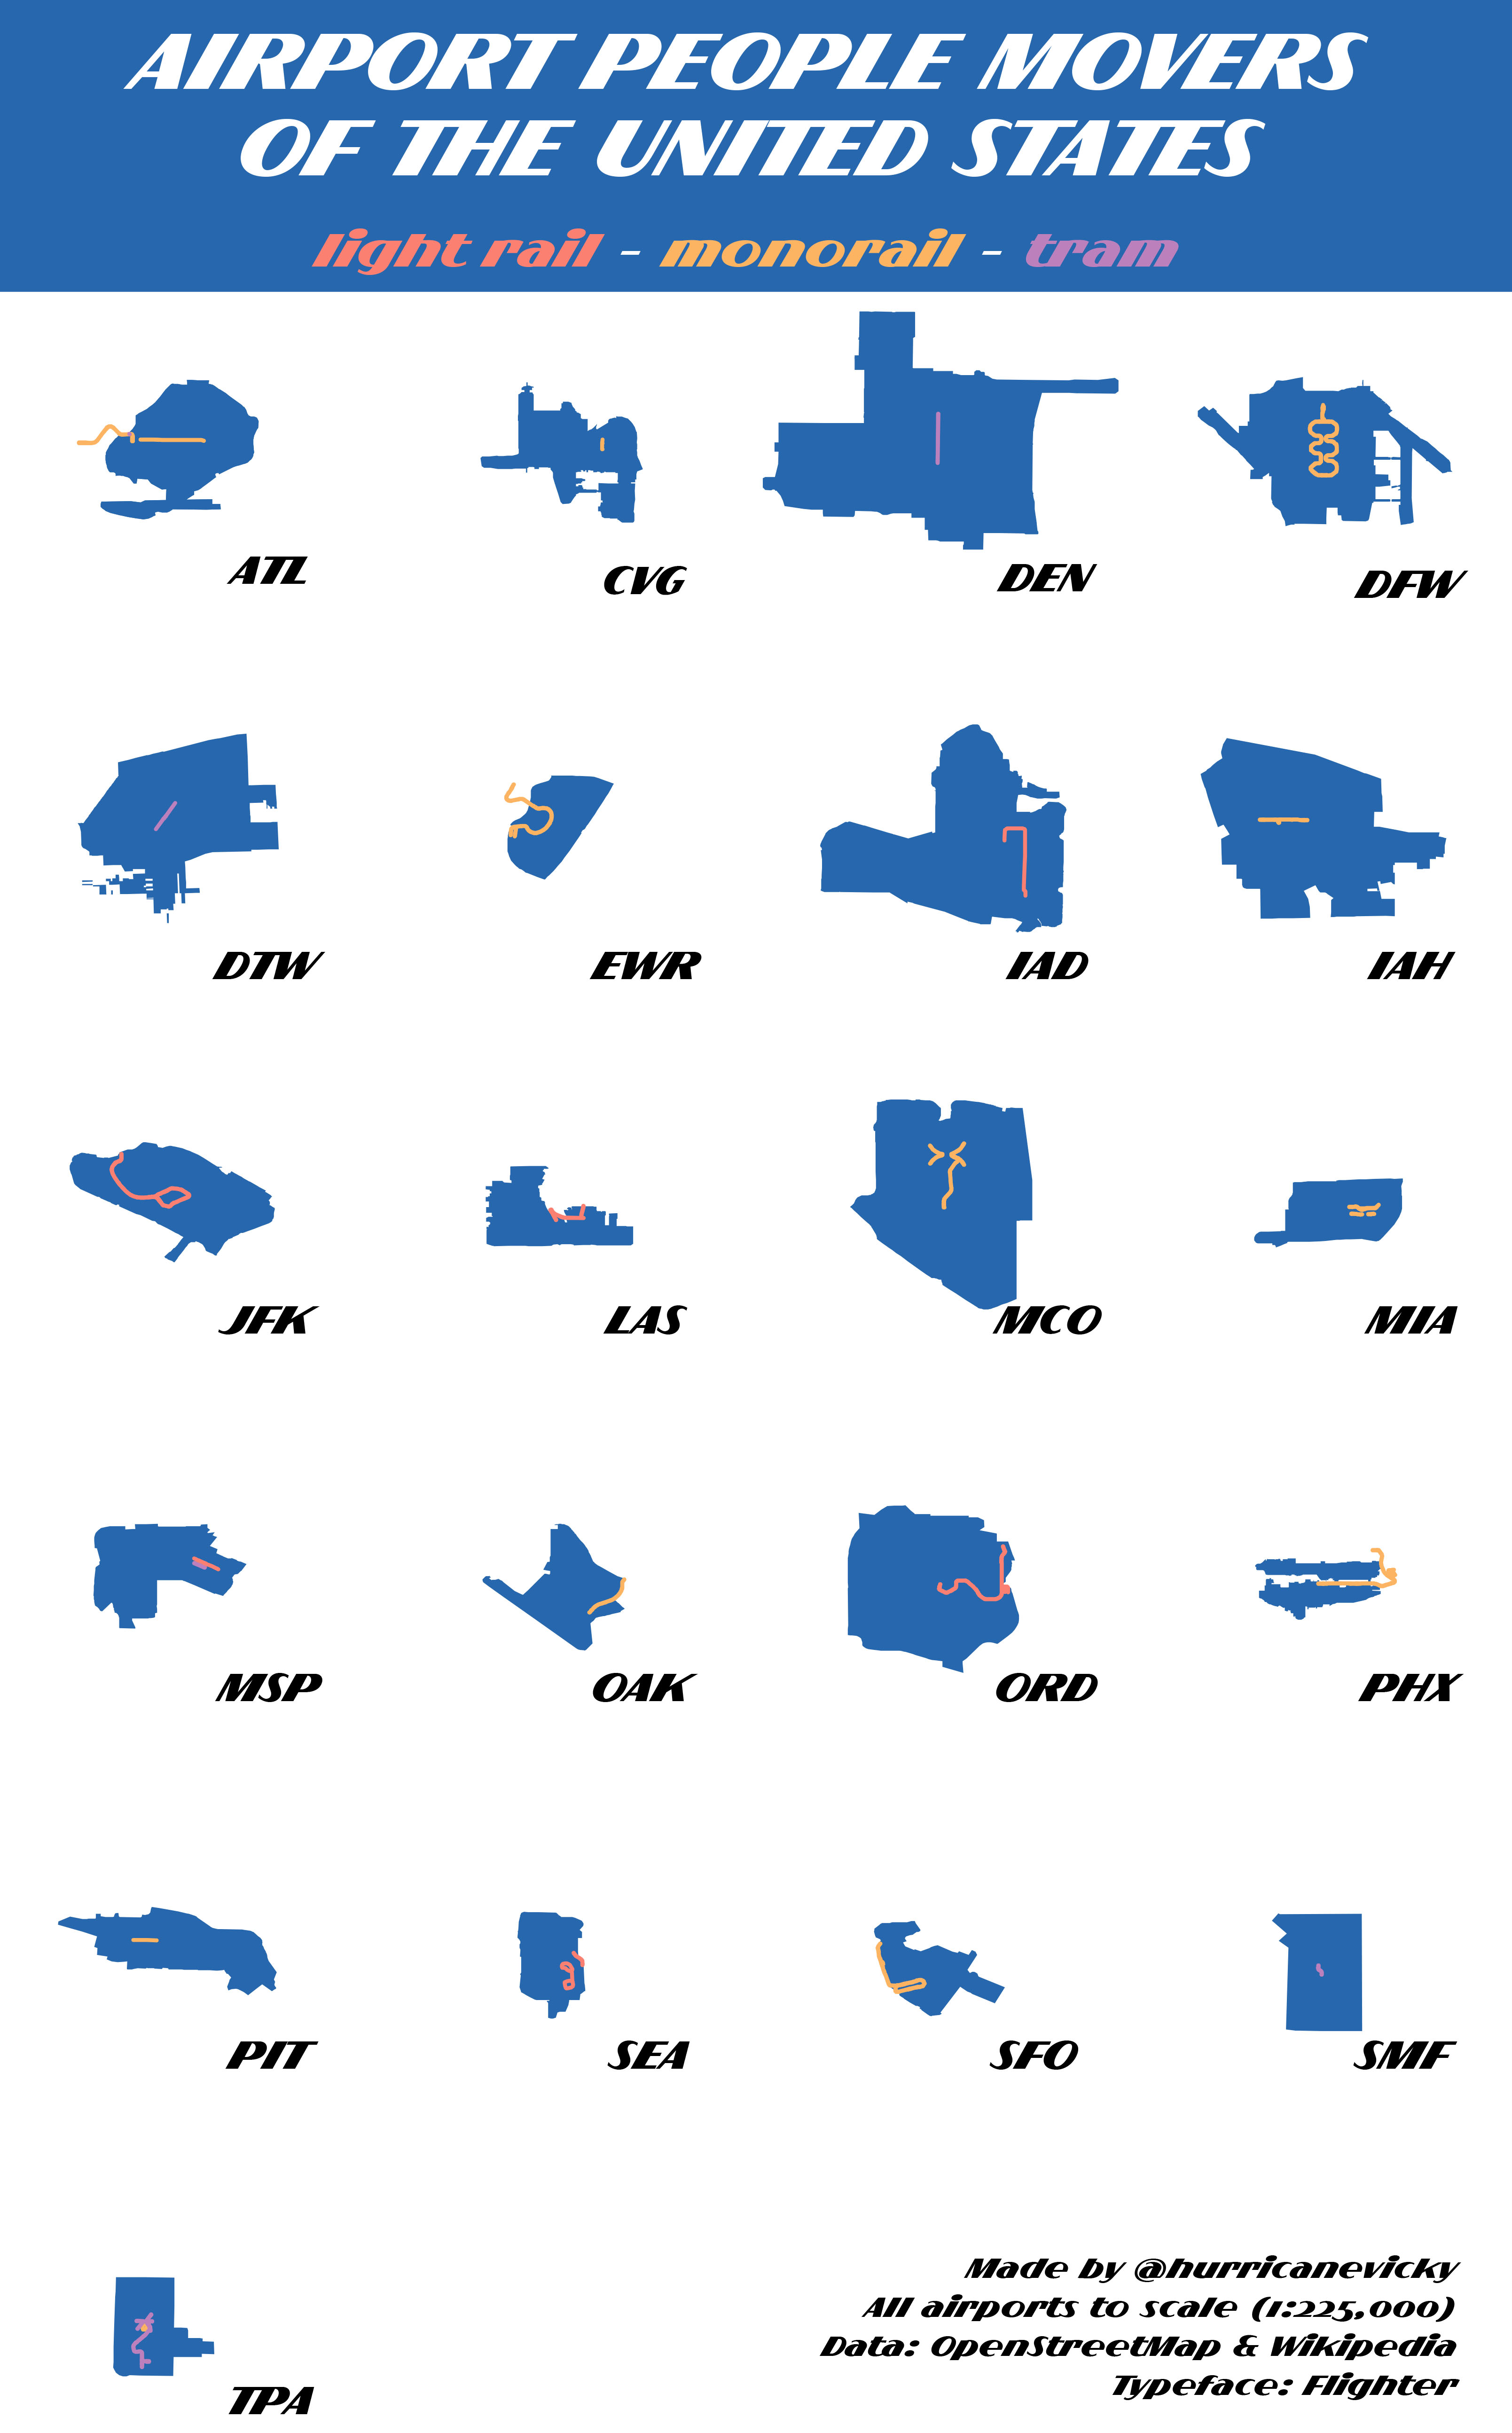 I’m finding the challenge to be great for clearing out halfbaked ideas; this is another one I had been kicking around for a while (still to come someday, the atlas of lazy rivers?). The three types are how they are listed in OpenStreetMap. Couple of notes here:
1. Denver’s airport is HUGE. The blue polygons are the full airport extents (aerodrome OSM tag), all of them are shown at the same 1:225,000 scale. DEN is the second-largest airport in the world by land area (the first being King Fahd International in Saudi Arabia). It is 52 square miles, or a Manhattan and a half.
2. I used this list on wikipedia, active systems only, because you have to draw the line somewhere. The Dulles line is the AeroTrain, which means my boyfriend the utterly magnificent Dulles People Mover isn’t on it! Unrelated to the map but if you have ten minutes I recommend spending them with this ultracharming Charles and Ray Eames-produced video about it from 1958.
3. That is not an error the Minneapolis-St Paul airport has two independent parallel systems, a people mover and a tram.
4. Still successfully avoiding making a traditional legend.
Data from OpenStreetMap and this wiki list of airport people mover systems. Typeface is Flighter.
November 21: Water
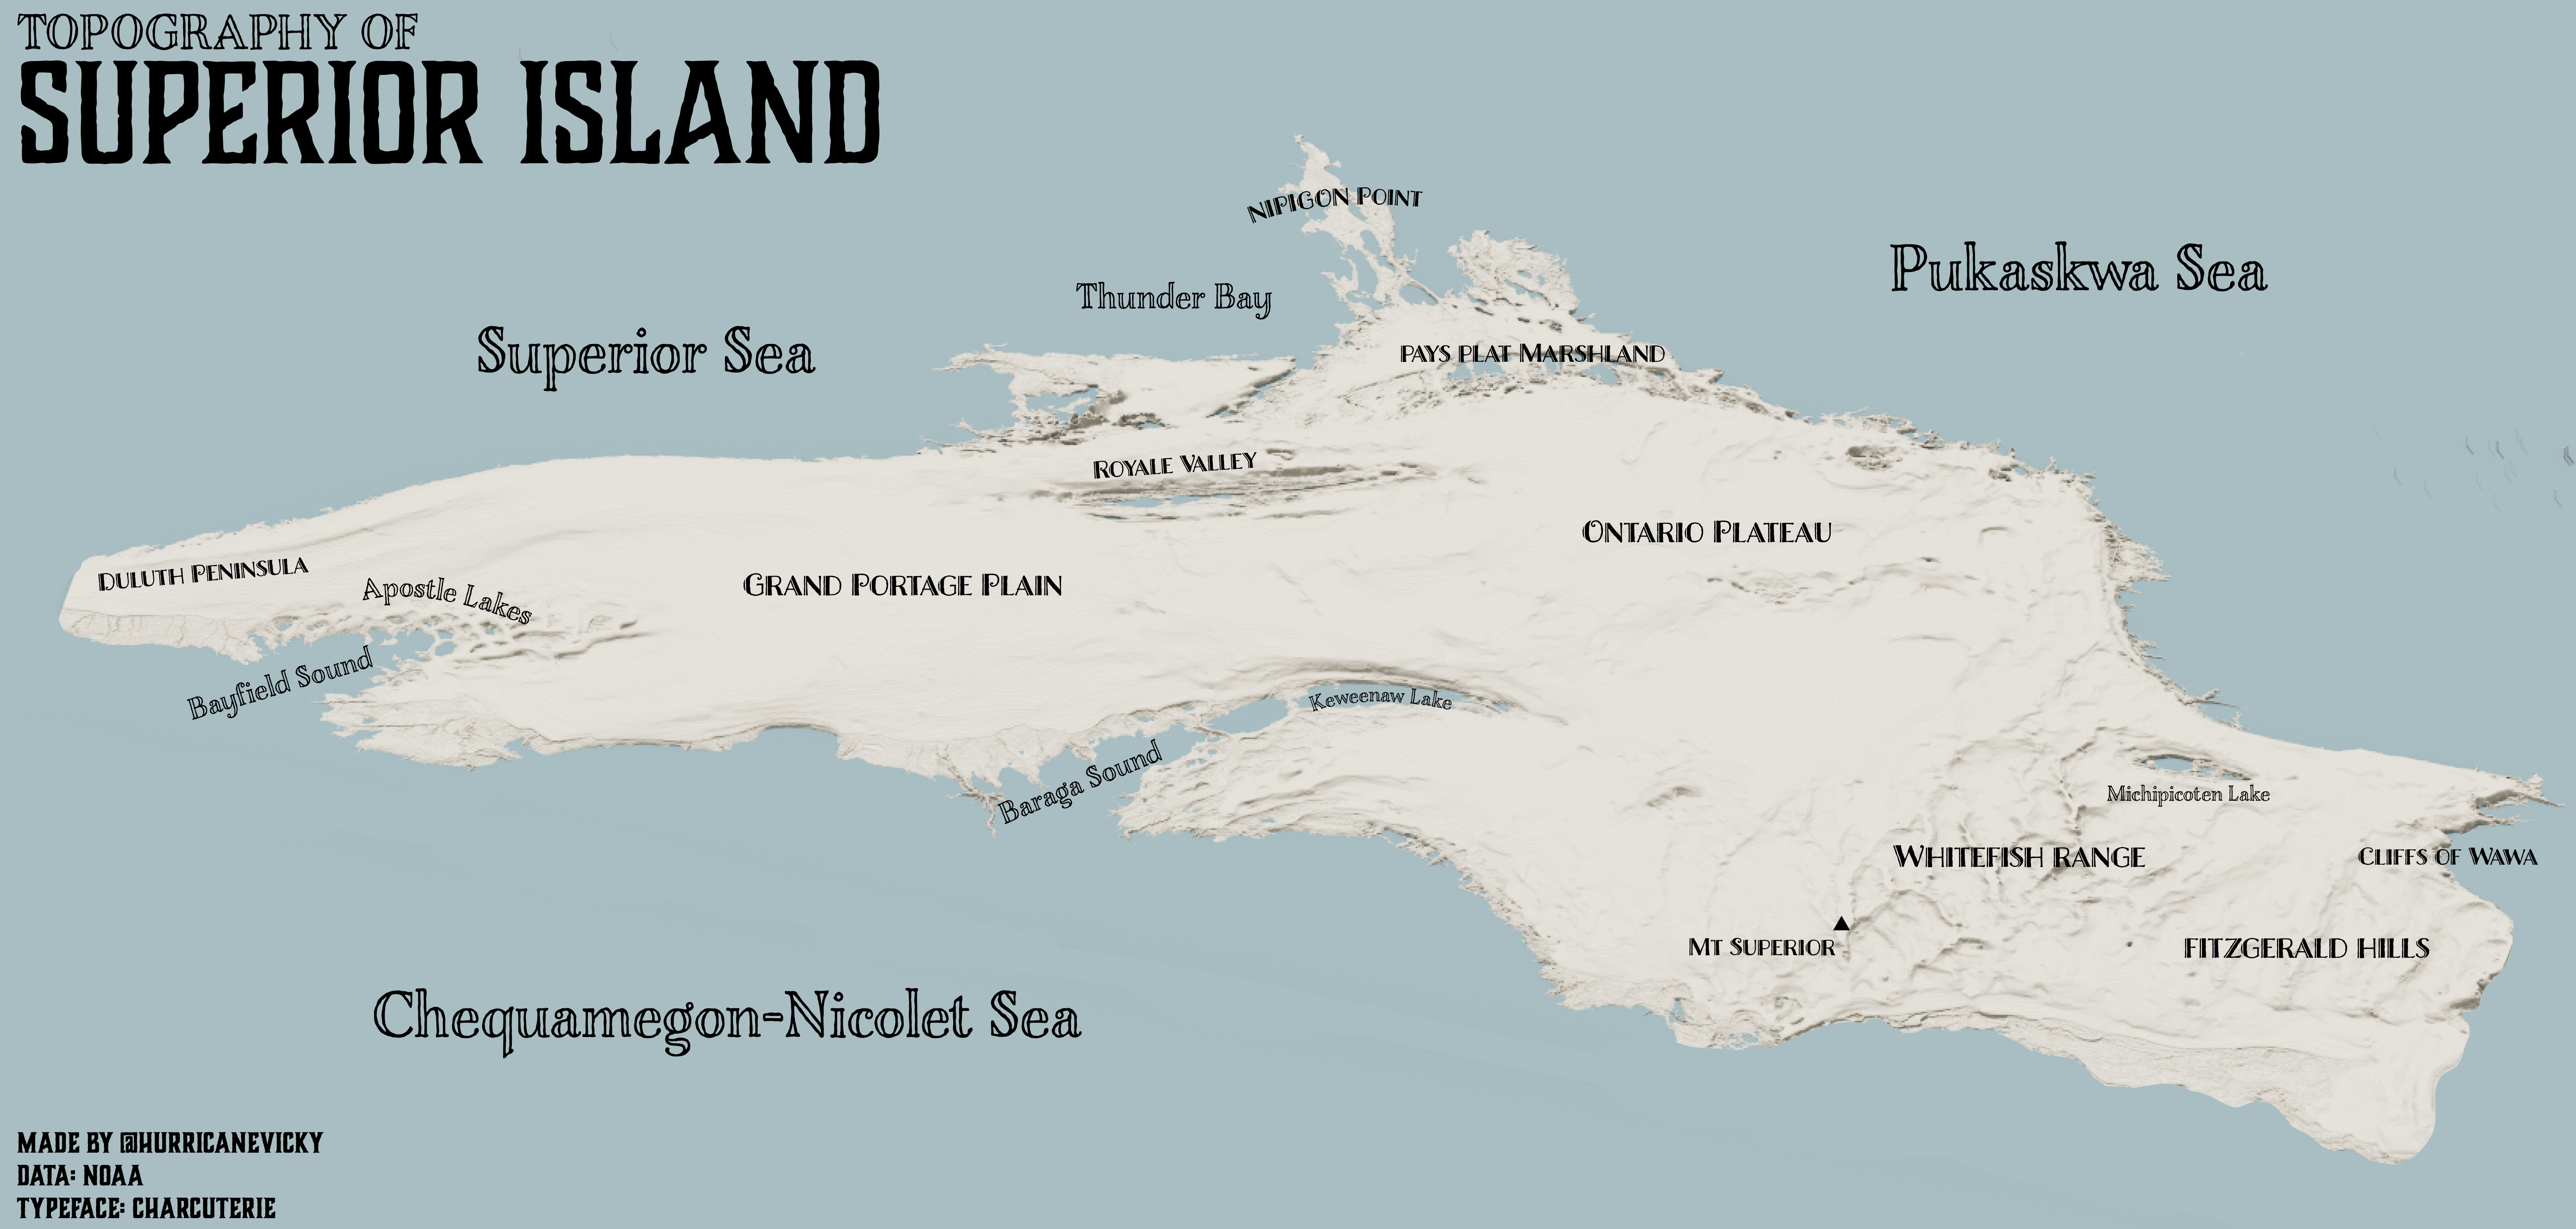 Once again only half-listening to the prompt, here I inverted the bathymetry of Lake Superior and turned it into Superior Island. Once I had the terrain looking reasonable - there isn’t exact science with fake land, just a lot of nudging and shifting in Photoshop - all I did was label the features with the names of places from around the area (Thunder Bay worked especially well).
Data from NOAA. Typeface is Charcuterie.
November 20: Population
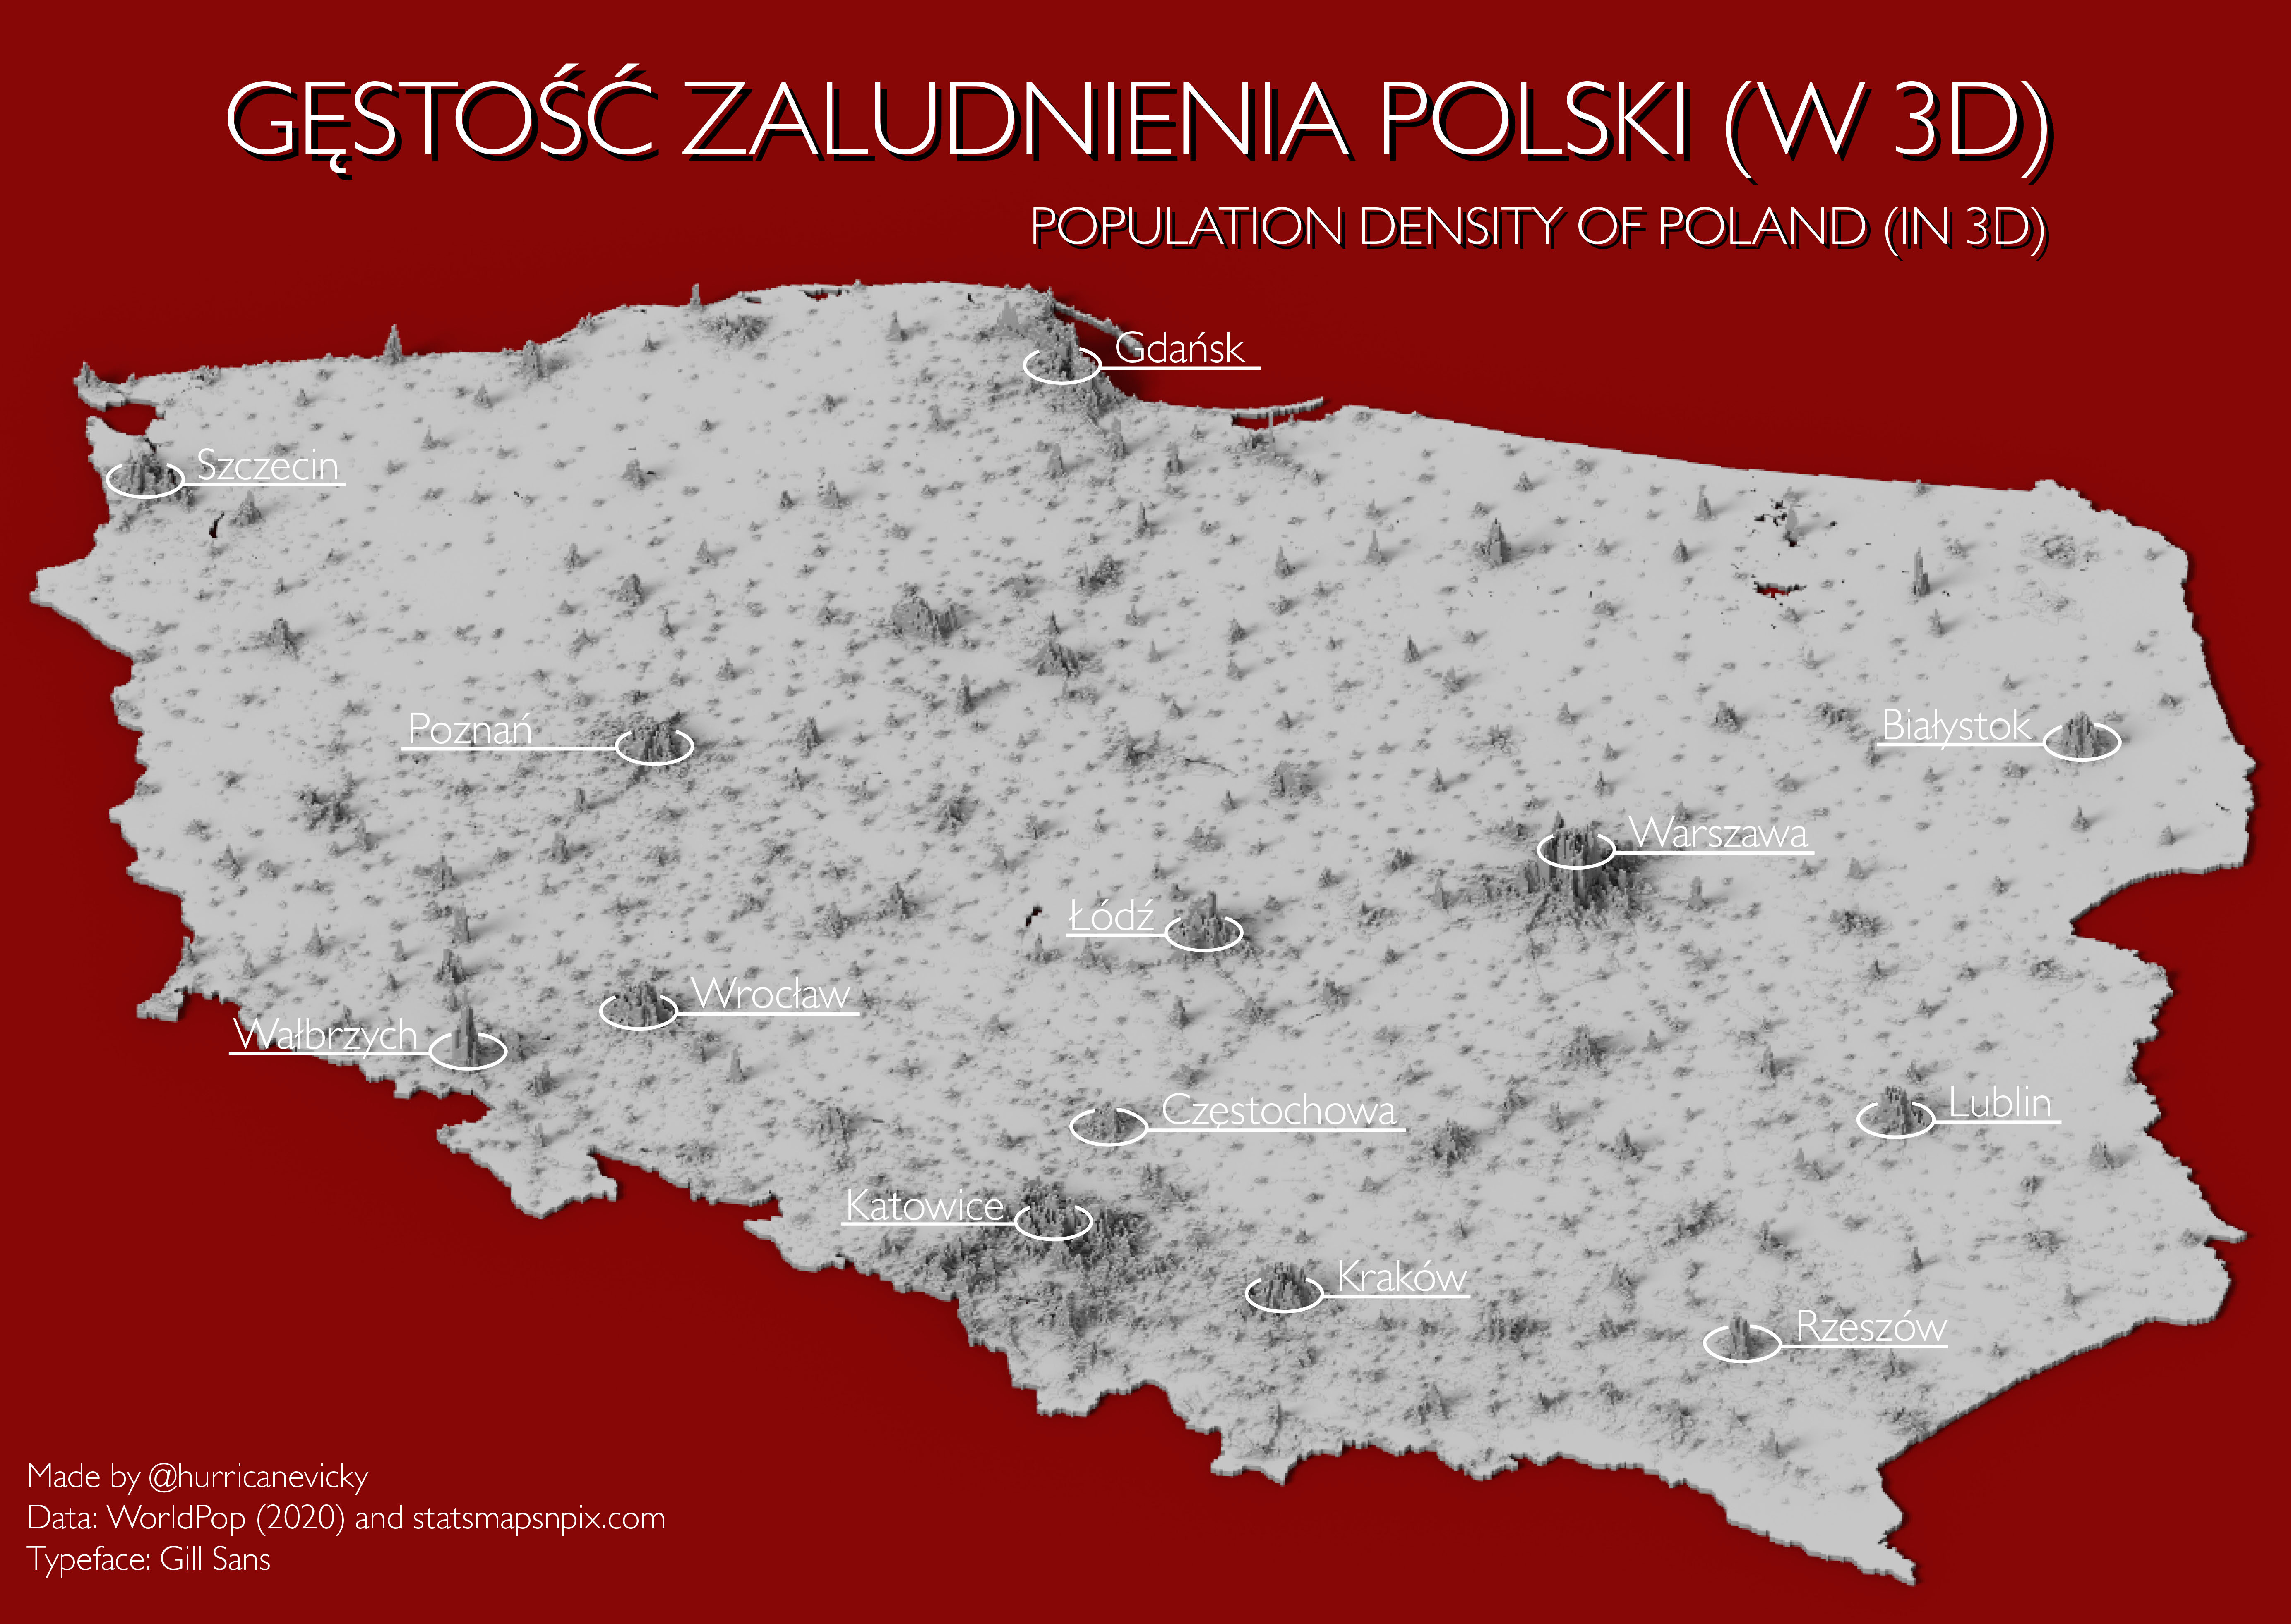 One of the best aspects of the 30 Day Map Challenge is that it’s a global challenge, so by the time I’m sitting down to make mine, the hashtag is already busy with wonderful cartography from mappers all over the world. I noticed a bunch of lovely work pointing towards Alasdair Rae’s 3D population density render and had to try it out for myself.
Data from WorldPop rendered in AerialOD. Title translated in, uh, Google Translate. Mówię trochę po polsku but it’s more like “soup, please” than any technical terminology. Typeface is Gill Sans.
November 19: NULL
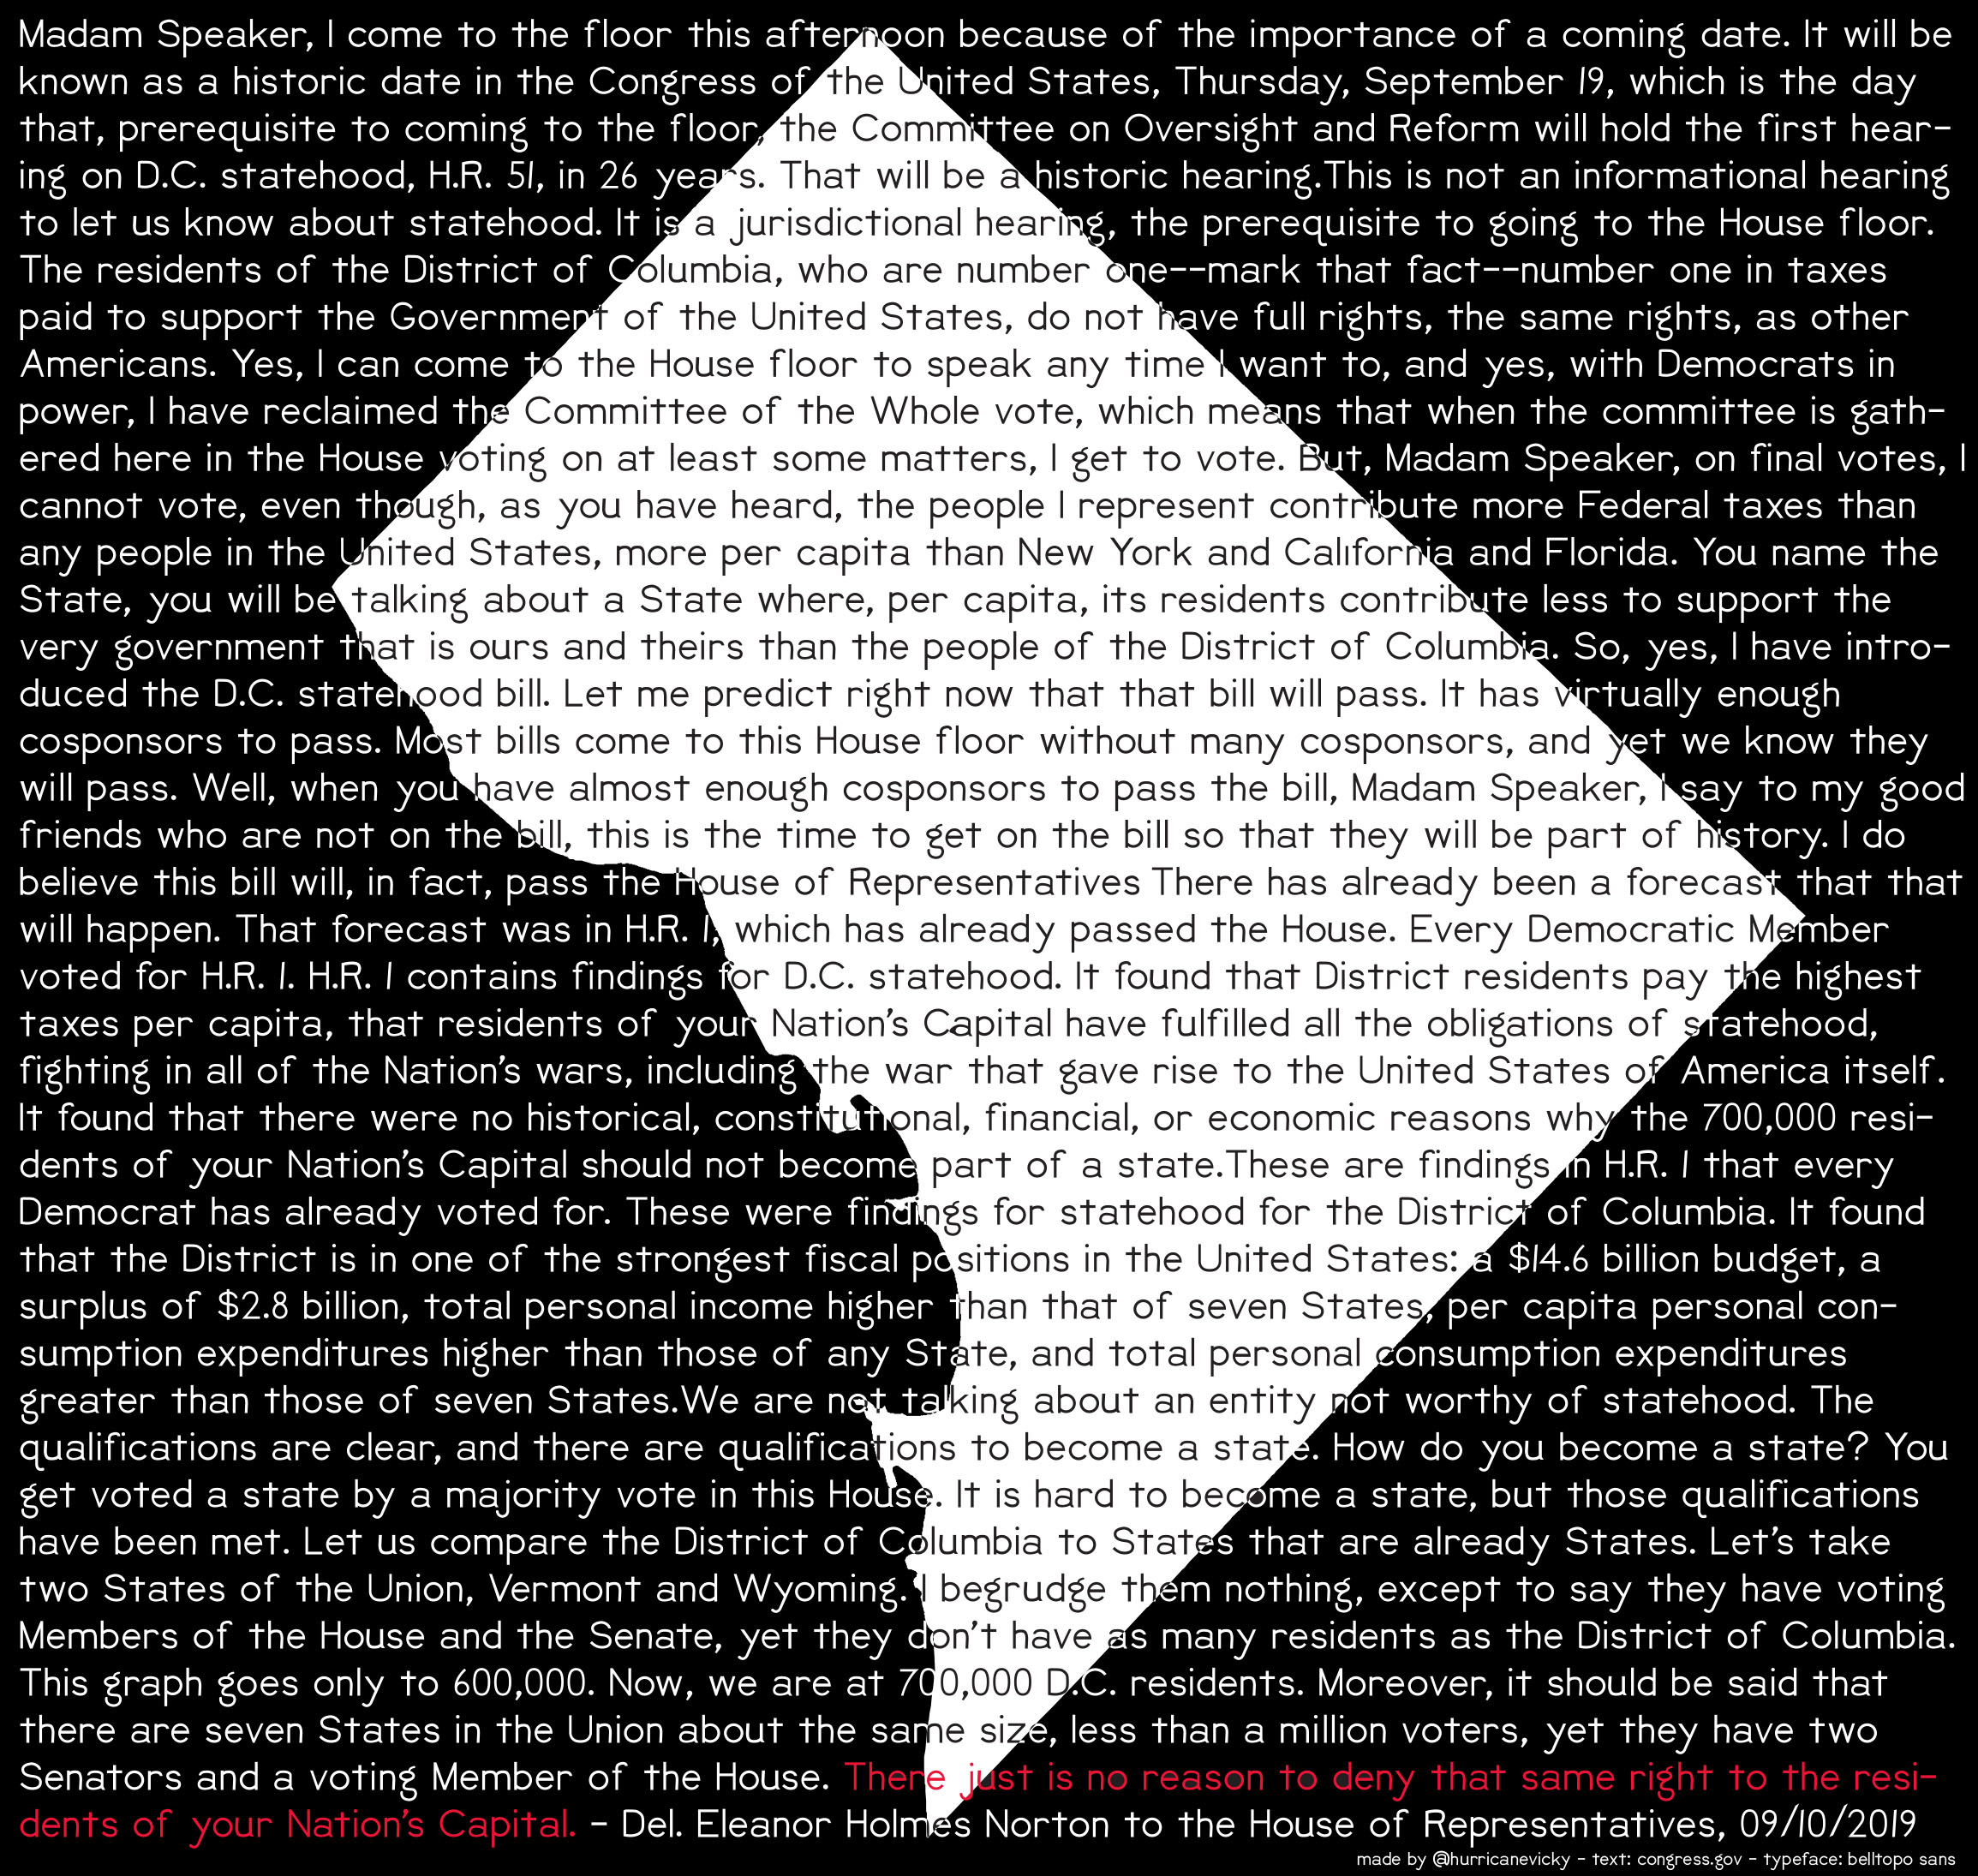 Juuuust to drive yesterday’s point home.
Text is from a short but persuasive speech DC Delegate/non-voting Congresswoman Eleanor Holmes Norton gave to the House last year, you can read the full thing here if you’d like (it’s also easier to read in non-map format, though I am impressed by how readable BellTopo Sans is for a big block of text), shape of DC from DC Open Data.
November 18: Landuse
 Originally I was going to a whole month of DC maps. You will note that that derailed on day two.
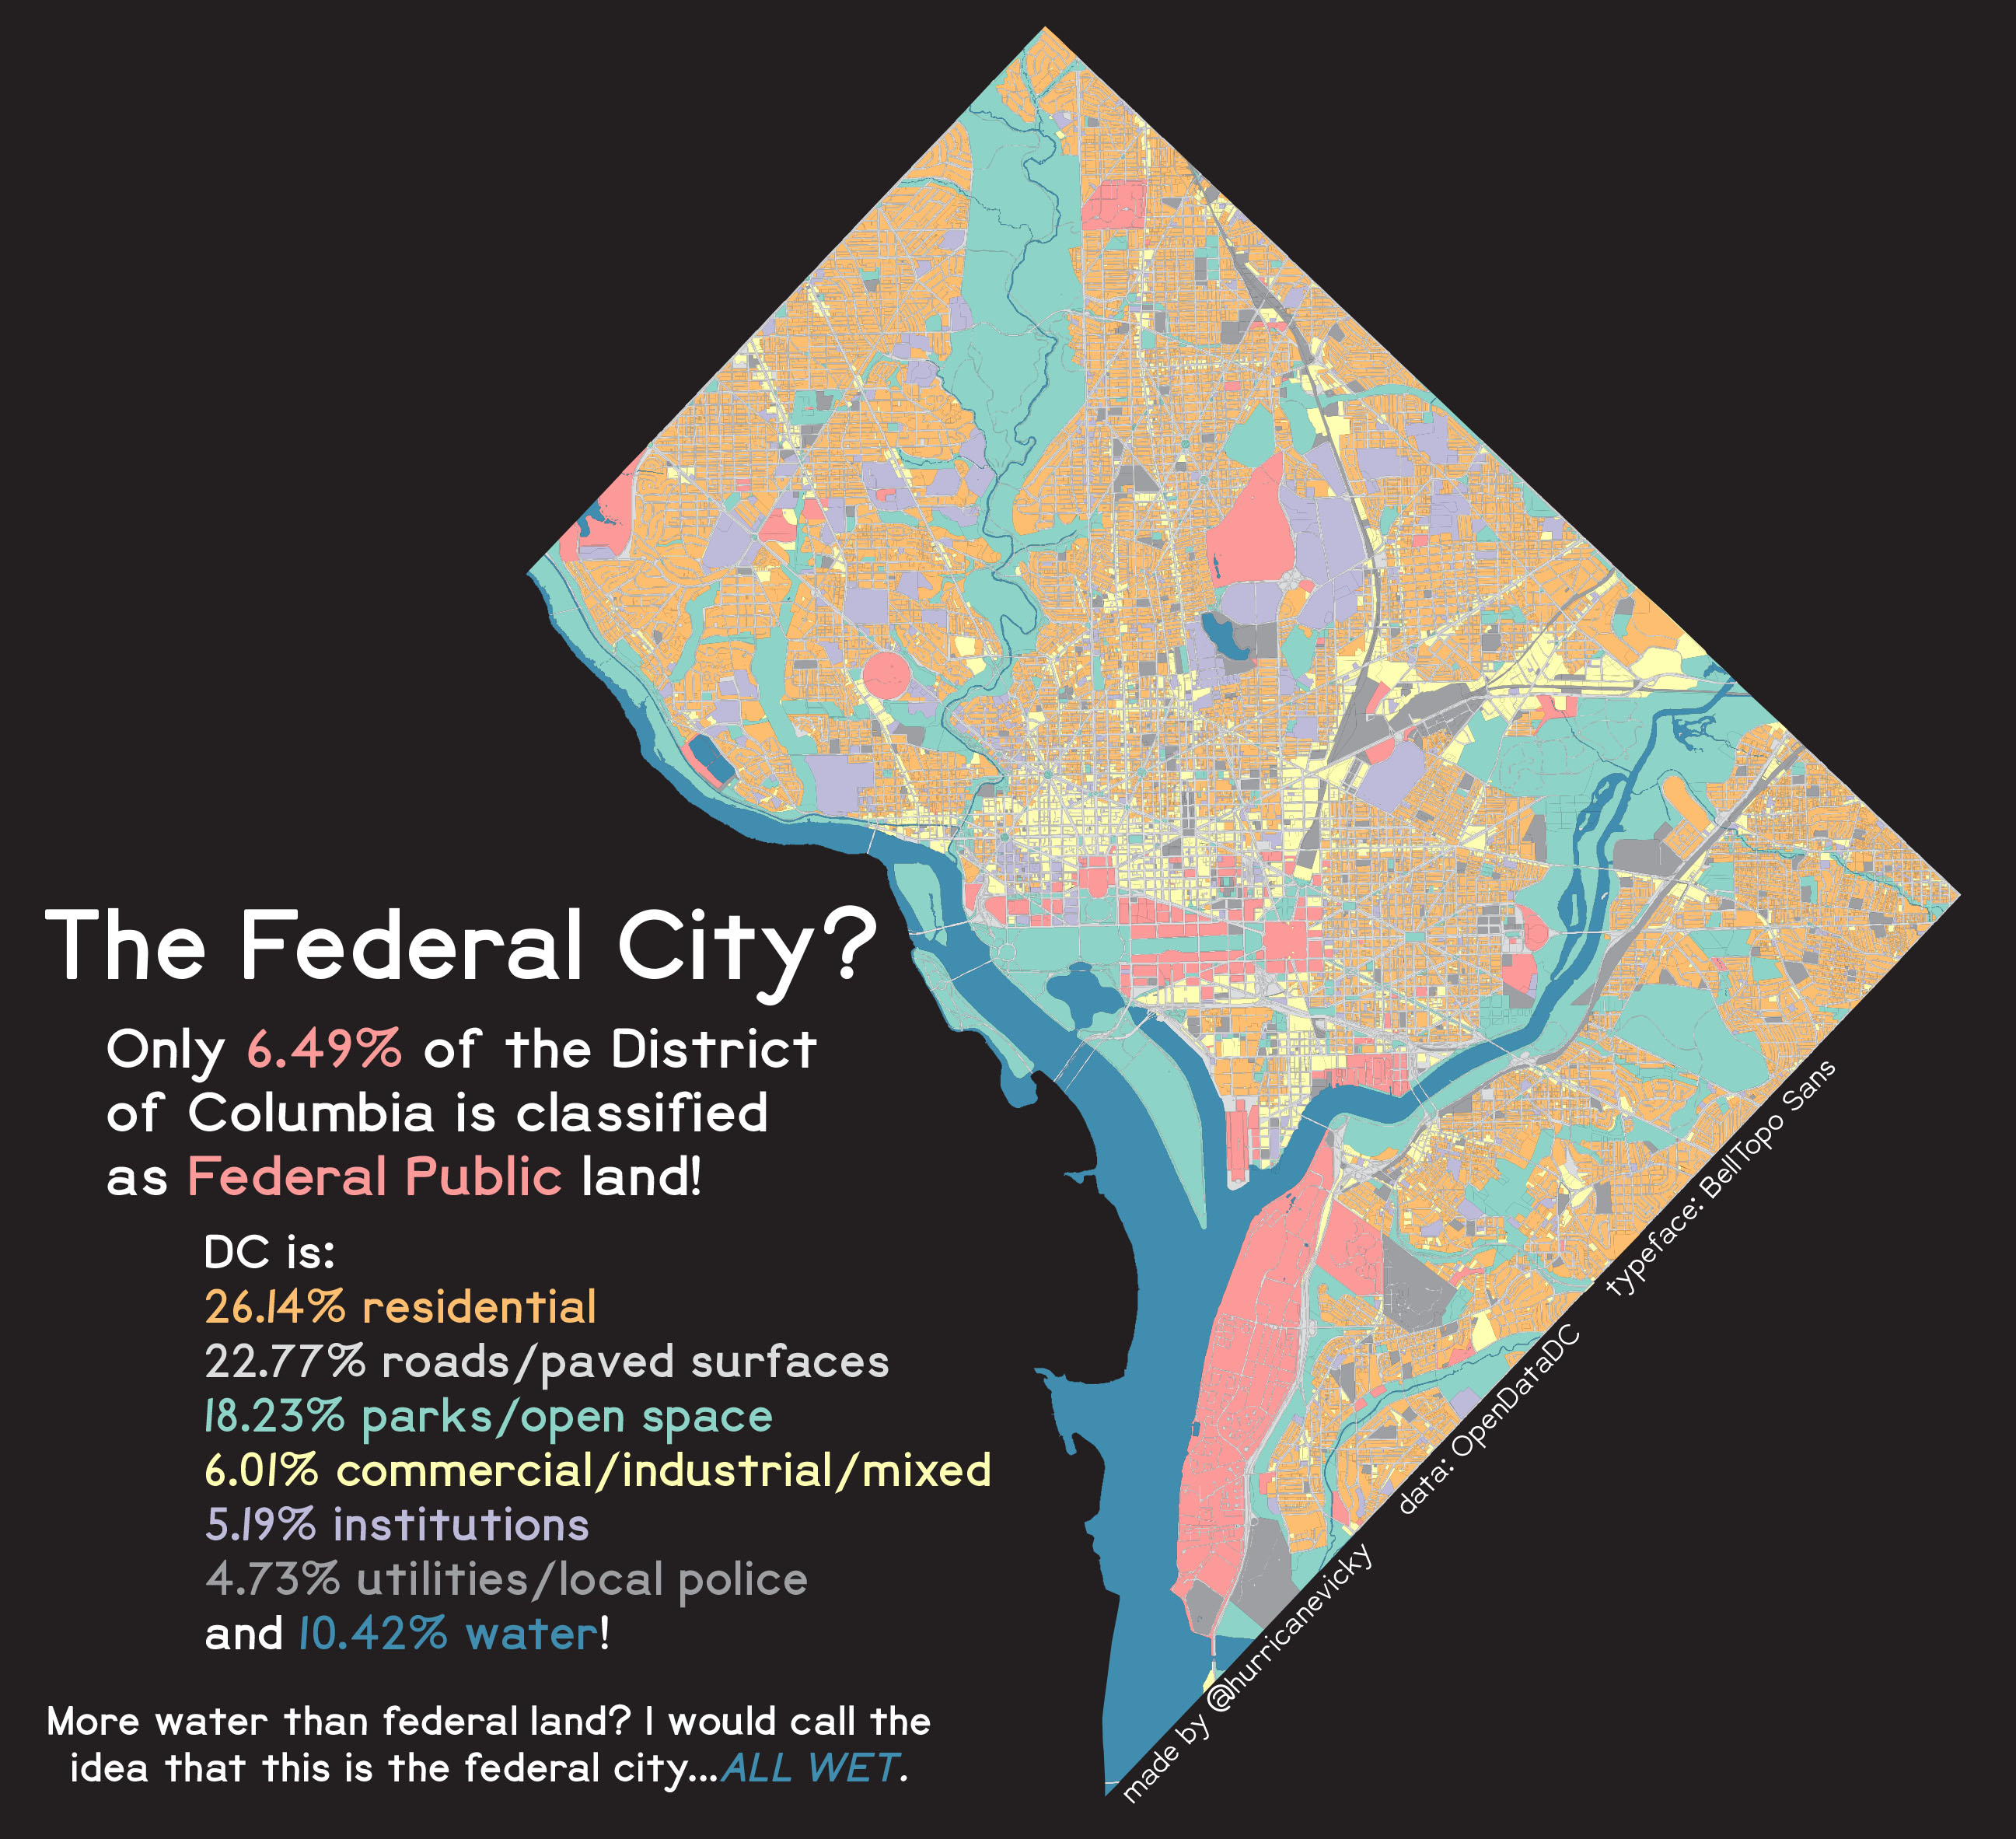
But I really love the DC Open Data portal and how much information about the structure of my city is freely accessible in a variety of formats. I think about broader public perceptions of the District a lot, probably too much, and I am an insufferable windbag about correcting people who use ‘DC’ as shorthand for Congress, particularly when complaining about it, because the object of their metonymy has no voting representation in the body they’re complaining about!!! Ahhh!!!!! So for this one I grabbed the Existing Land Use dataset from DCOD, combined a few logical categories (rivers, lakes, and canals became ‘water,’ for example) and put them on a map that imo looks rather nice. As the dataset included area for each polygon, a little math - thank u Heidi, patron saint of the pivot table - gave me the percentage of the District in each category to underline the purpose of this map, which is that DC is only a small percent federal, it is a normal city, people live and work here outside of national politics. One afterthought, I would like to see similar maps of areas with a big federal or military presence, just to see how we compare.
Of course I was just saying how there are very few nitpicky cranks but some emerged to complain about this one. Water isn’t land, Rock Creek Park is controlled by the National Park Service so it should be reclassed. And, I mean, I get it, but look. Rock Creek Park is first and foremost a park and it is classified as a park. I’m not about to bring a picnic to the grounds of Joint Base Anacostia-Bolling. Old Soldier’s Home has great greenspace right in my neighborhood but it’s not classified as a park because it’s a military retirement home. A key component of landuse is the USE, and I think that these are classified appropriately. As for water, I could have excluded it from the calculations, but why? It’s included in the landuse dataset because it is part of the District of Columbia. But the main response I have to these is that classification is a choice made by the cartographer when reviewing the data. Every map is a story, and the choices a cartographer makes affects how that story is told and understood. Classifiying the data differently tells a different story: yes!!! That’s what mapping IS!!!! Ugh.
Data from DC Open Data. Typeface is BellTopo Sans.
November 17: Historical
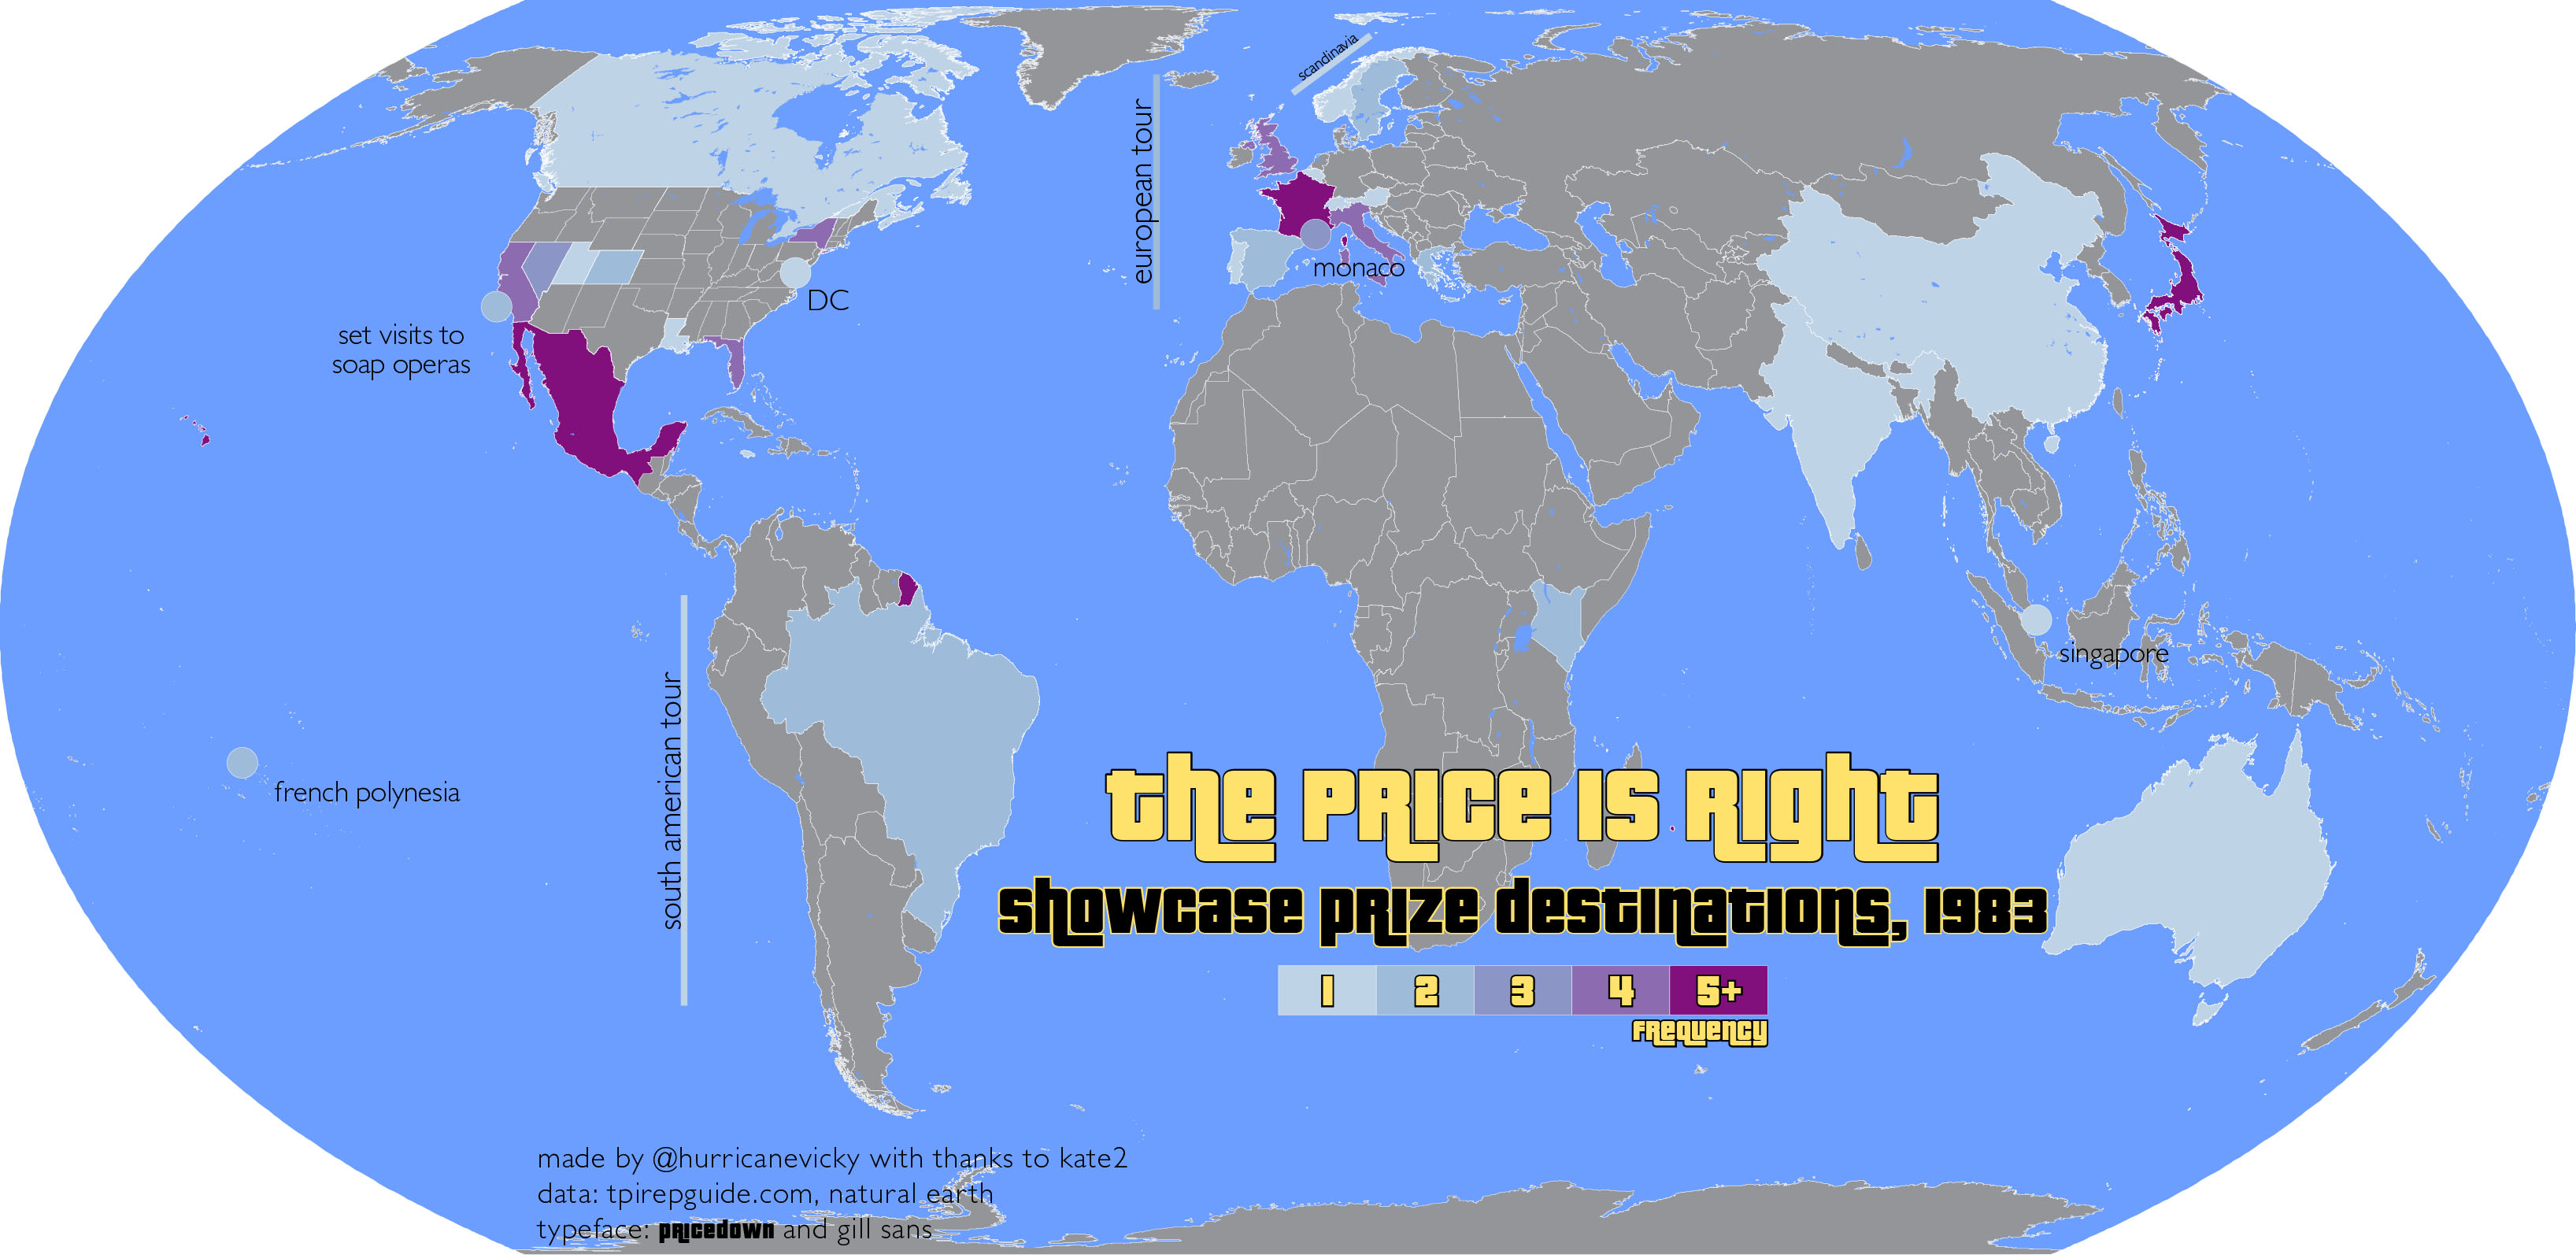 For the historical theme, let’s reach all the way back to 1983 (ancient history) and look at the destinations The Price Is Right offered as prizes in the Showcase portion of the program! This is an idea I’d been kicking around for a while with my friend Kate Doyle, and one I hope to revisit at some point. The data was clumsily, manually taken from the affectionately detailed but irregularly organized summaries at The Price is Right Episode Guide. Like any good internet niche, the TPIR Ep Guide writer includes some deadpan editorializing, in this case often relating to presumed strategies and the amount of screaming upon a win, which made the data gathering process more amusing than perhaps I made it sound two sentences ago.
The map picked up a little traction on twitter and lots of folks offered to help me figure out a way to scrape the site for the aforementioned revisit, which was very cool. I’ve been a cartographer for over a decade now and I am still somewhat reserved about sharing my work publicly, especially for something like this challenge where I’m not exactly spending a ton of time on the project (these are all made after the work day ends). I’ve been really heartened by the positive community around the 30 Day Map Challenge, very few nitpicky cranks out there (there will always be some).
Data from the The Price is Right Episode Guide and Natural Earth, which you must be used to seeing by now. Typeface is Pricedown and Gill Sans. I should note that this is a slightly different version of the map than on twitter: the initial version used only Pricedown, which looked great but made the smaller text impossible to read. Gill Sans is a nice neutral type, lets Pricedown take center stage, doesn’t overwhelm the viewer, etc. Kate is ‘Kate2,’ there are two Kates in the friendship slack and that is how she asked to be credited.
November 16: Islands
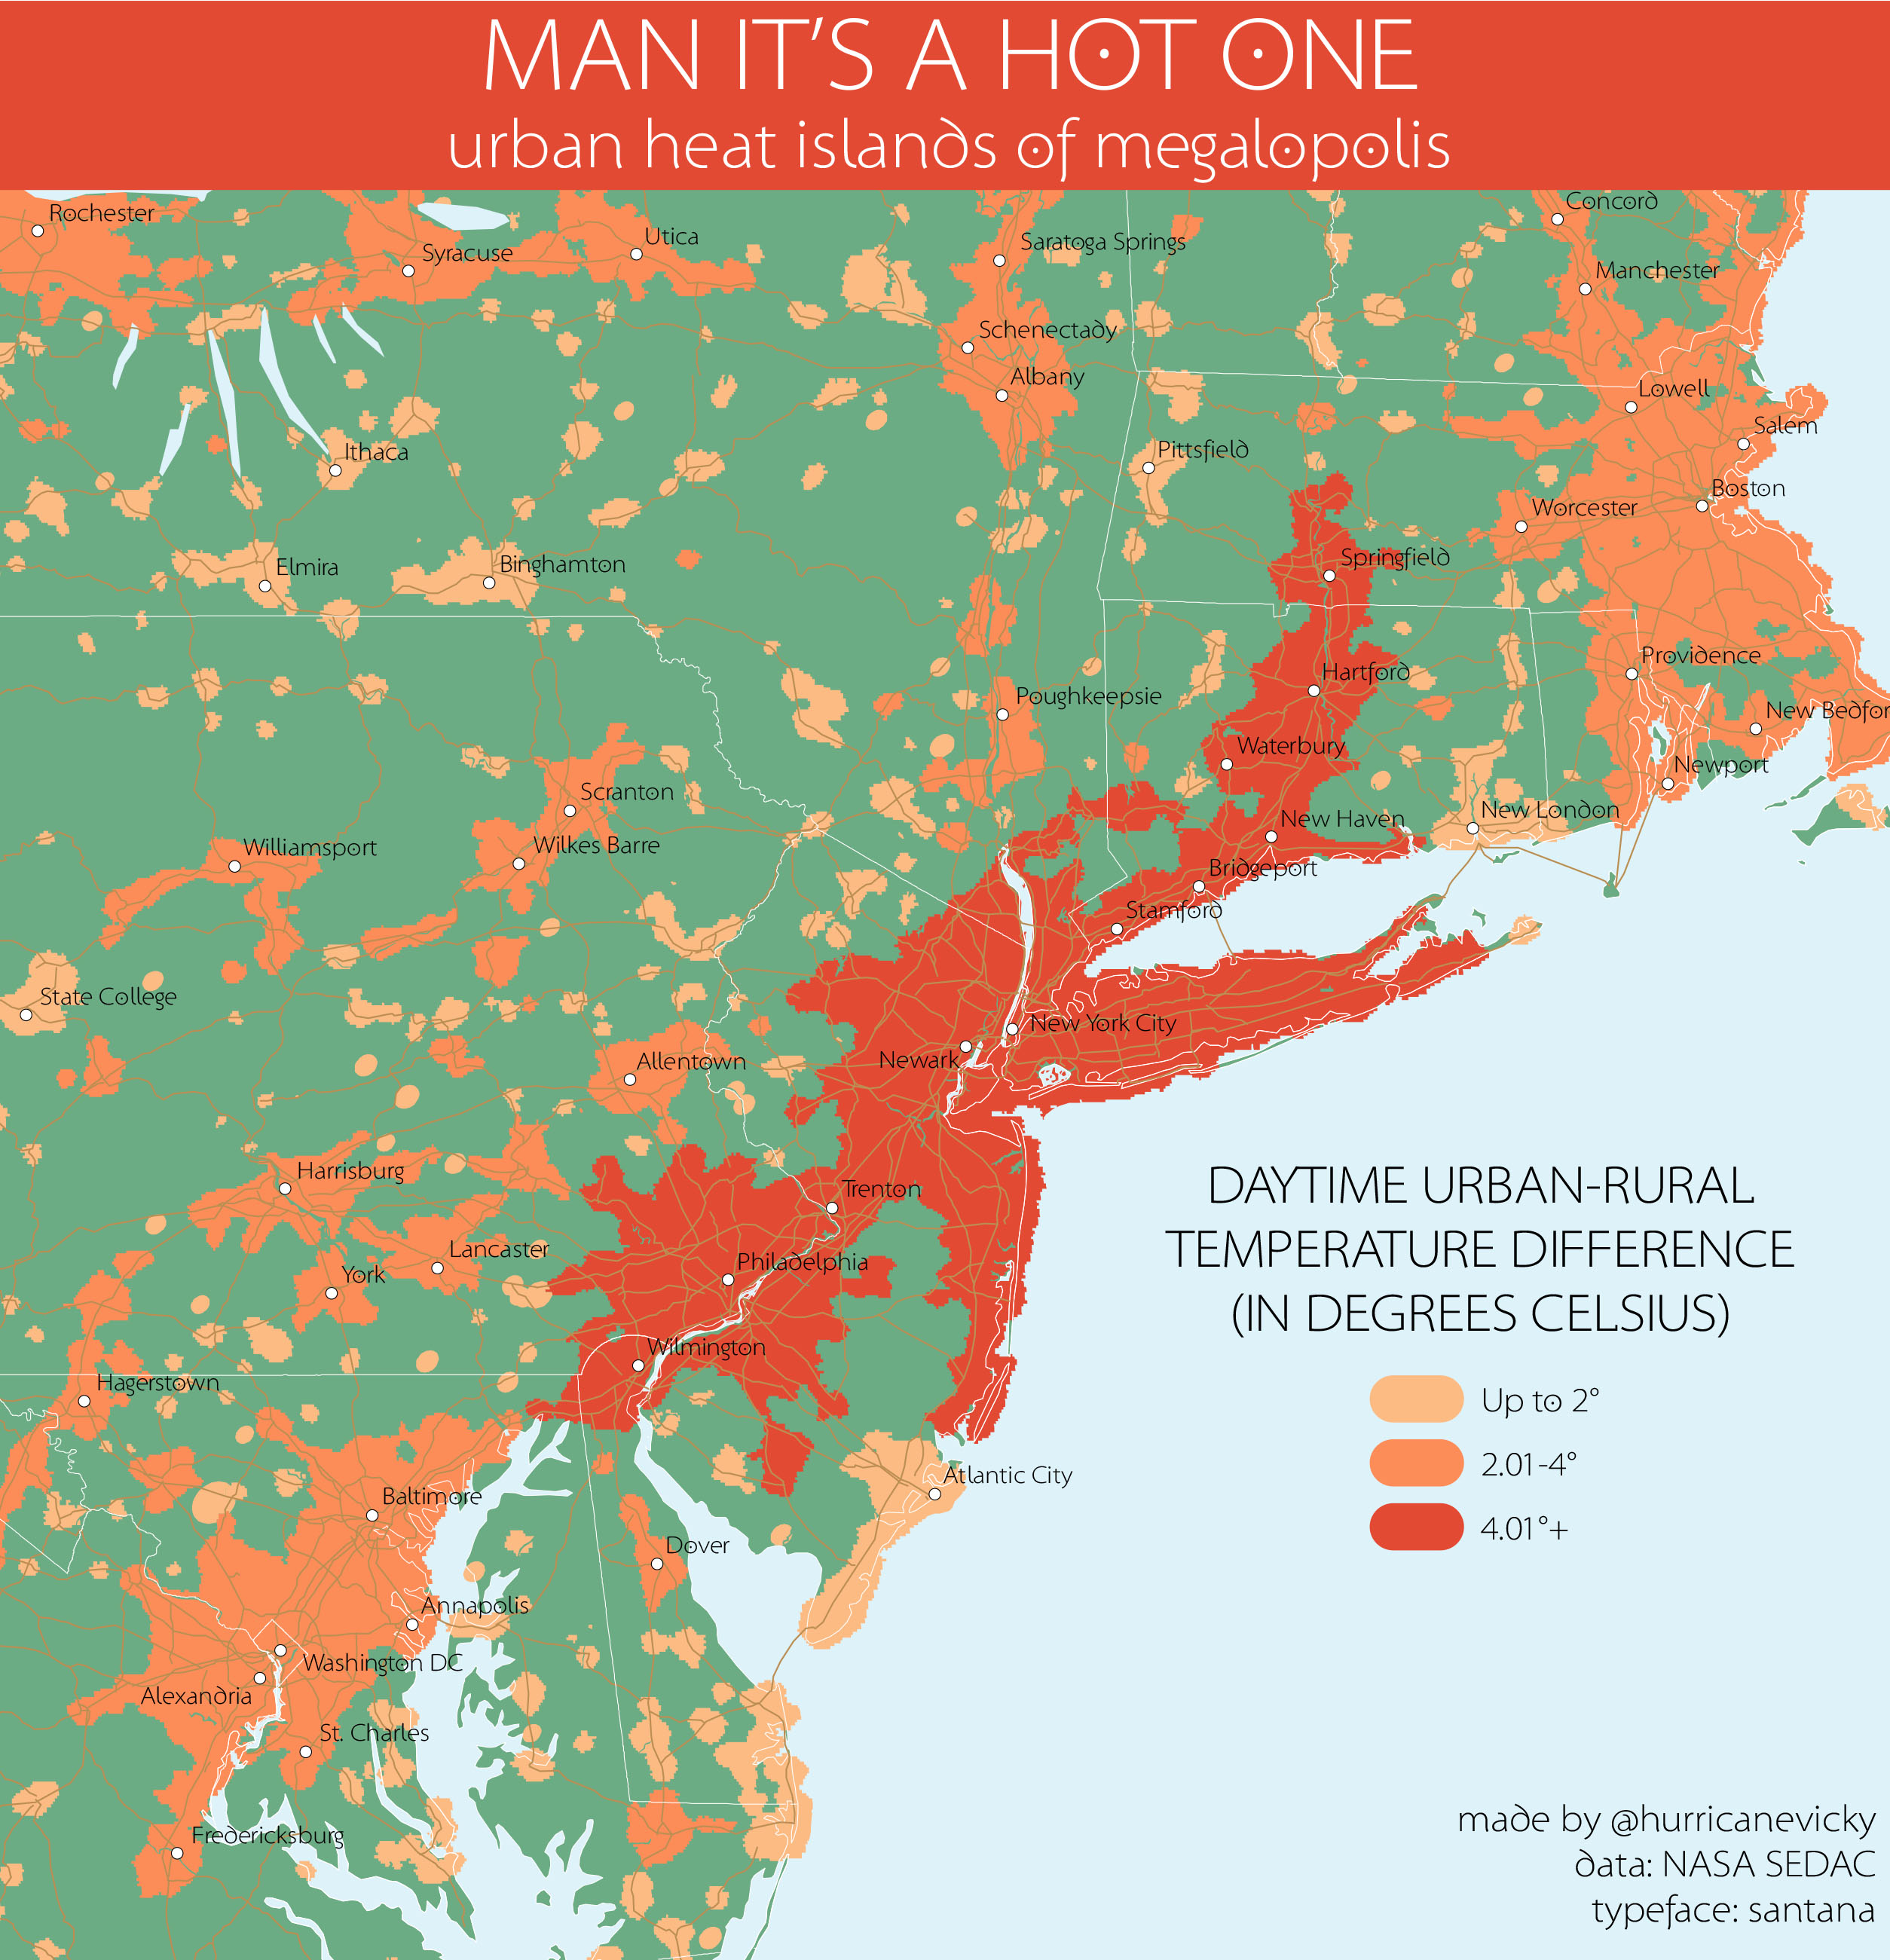 Taking a looser interpretation of the prompt here, also one of the few times when I’ve gotten a clear easy answer to the question “is there data for this?” NASA’s Socioeconomic Data and Applications Center (SEDAC) kindly maintains a set of satellite-derived environmental indicators like change in nighttime lights, availability of freshwater resources, and global urban heat islands! This also meant I could give the map an incredibly stupid title with the perfect typeface to match.
Data from the NASA SEDAC and Natural Earth. Typeface is Santana, which luckily for me looks nice.
November 15: Connections
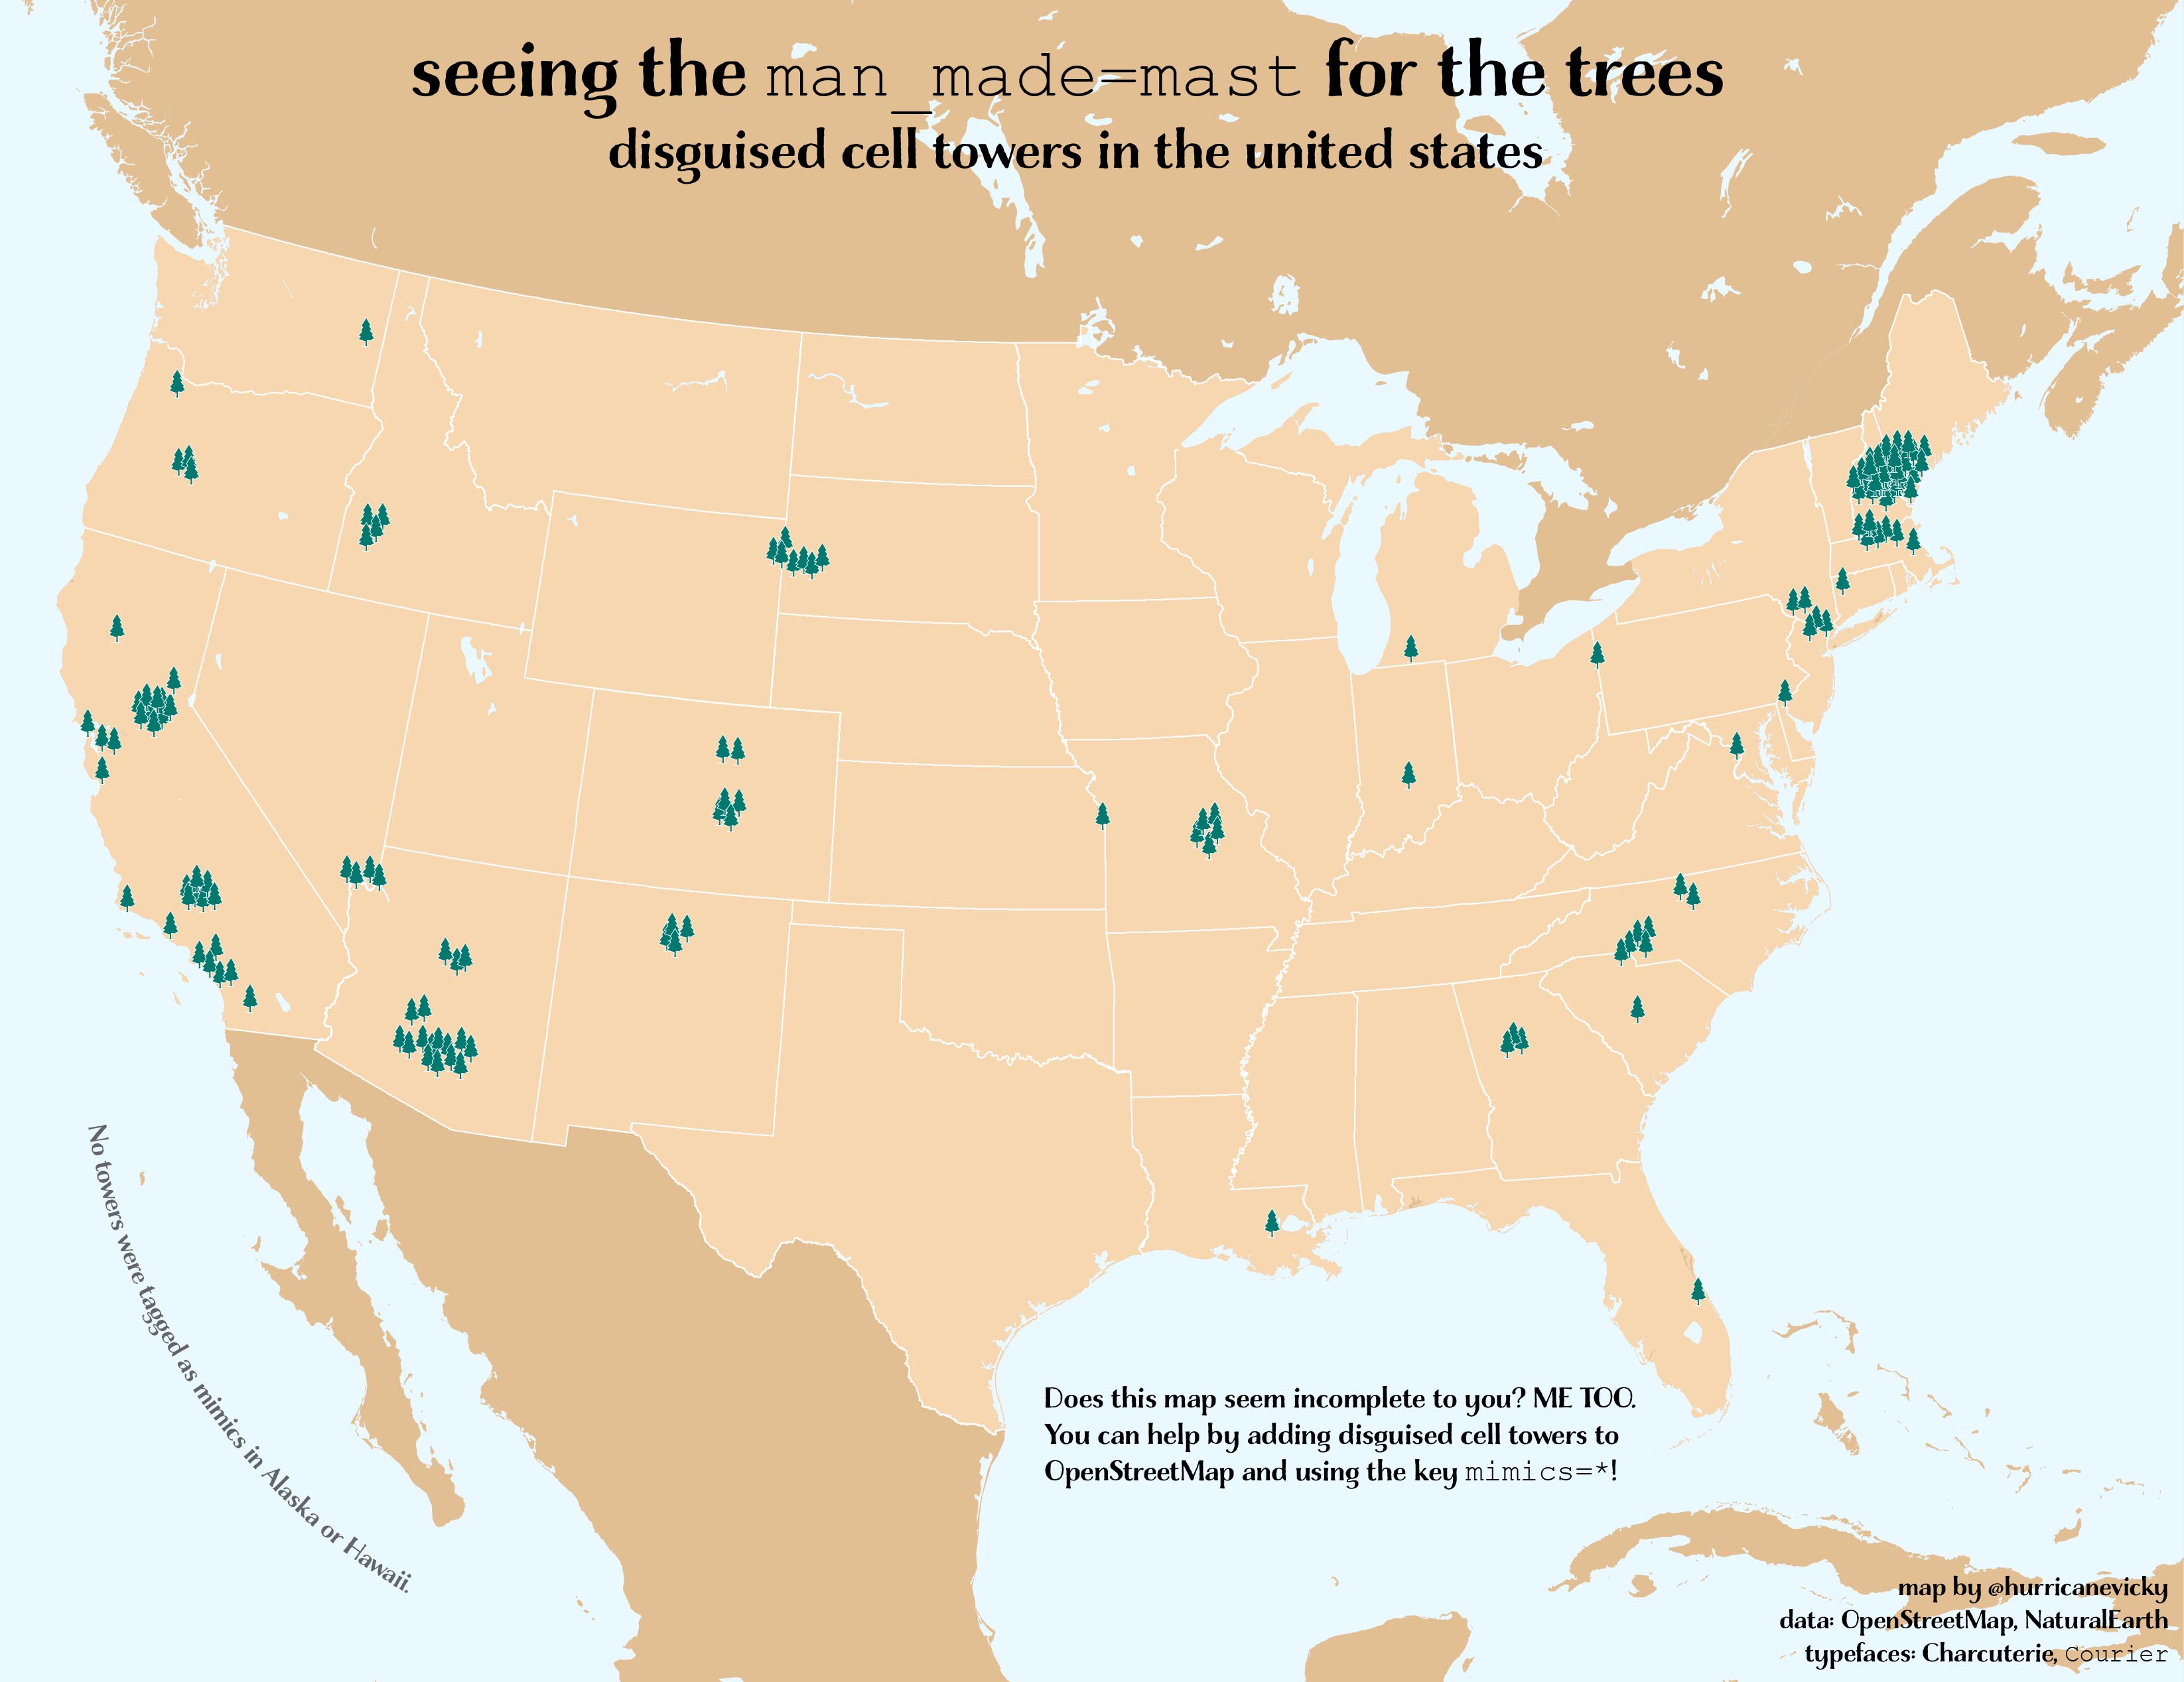 I love fake tree cell towers. They’re so goofy looking. Structural bathos. A map of their locations seemed like a novel way to approach the theme of ‘connections,’ and surely the FCC tracks their location, right? Wrong! Though the FCC does maintain a database of cell tower locations as part of their publicly available Homeland Infrastructure Foundation-Level Data, sadly for me it doesn’t include appearance. There are a number of other freely available databases of cell towers out there but none of them seem to include it, either. It took me honestly way too long to realize that if they were noted anywhere, it would be old reliable OpenStreetMap. Sure enough, the multitalented Eric Theise not only brought the OSM notation to life a year or so ago but wrote a delightful summary on the process of adding the key ‘mimics’ to cell towers (which are as a whole classified as man-made masts, hence the title). As the tag is new and not terribly well known, it is not a very complete dataset. Many are mapped as communications towers without the specific mimics tag but with the fact that they’re a fake tree noted elsewhere in the tags - the mimics tag serves the function of standardizing this (these are also included on the map, I am slowly adding the mimics tag to them in OSM). Eric’s writeup also includes helpful instructions on how to add the tag when you’re out mapping with the Go Map!! app.
Data from the OpenStreetMap via Overpass Turbo and Natural Earth. Typeface is Charcuterie and, for the code-y bits, Courier.
November 14: Climate Change
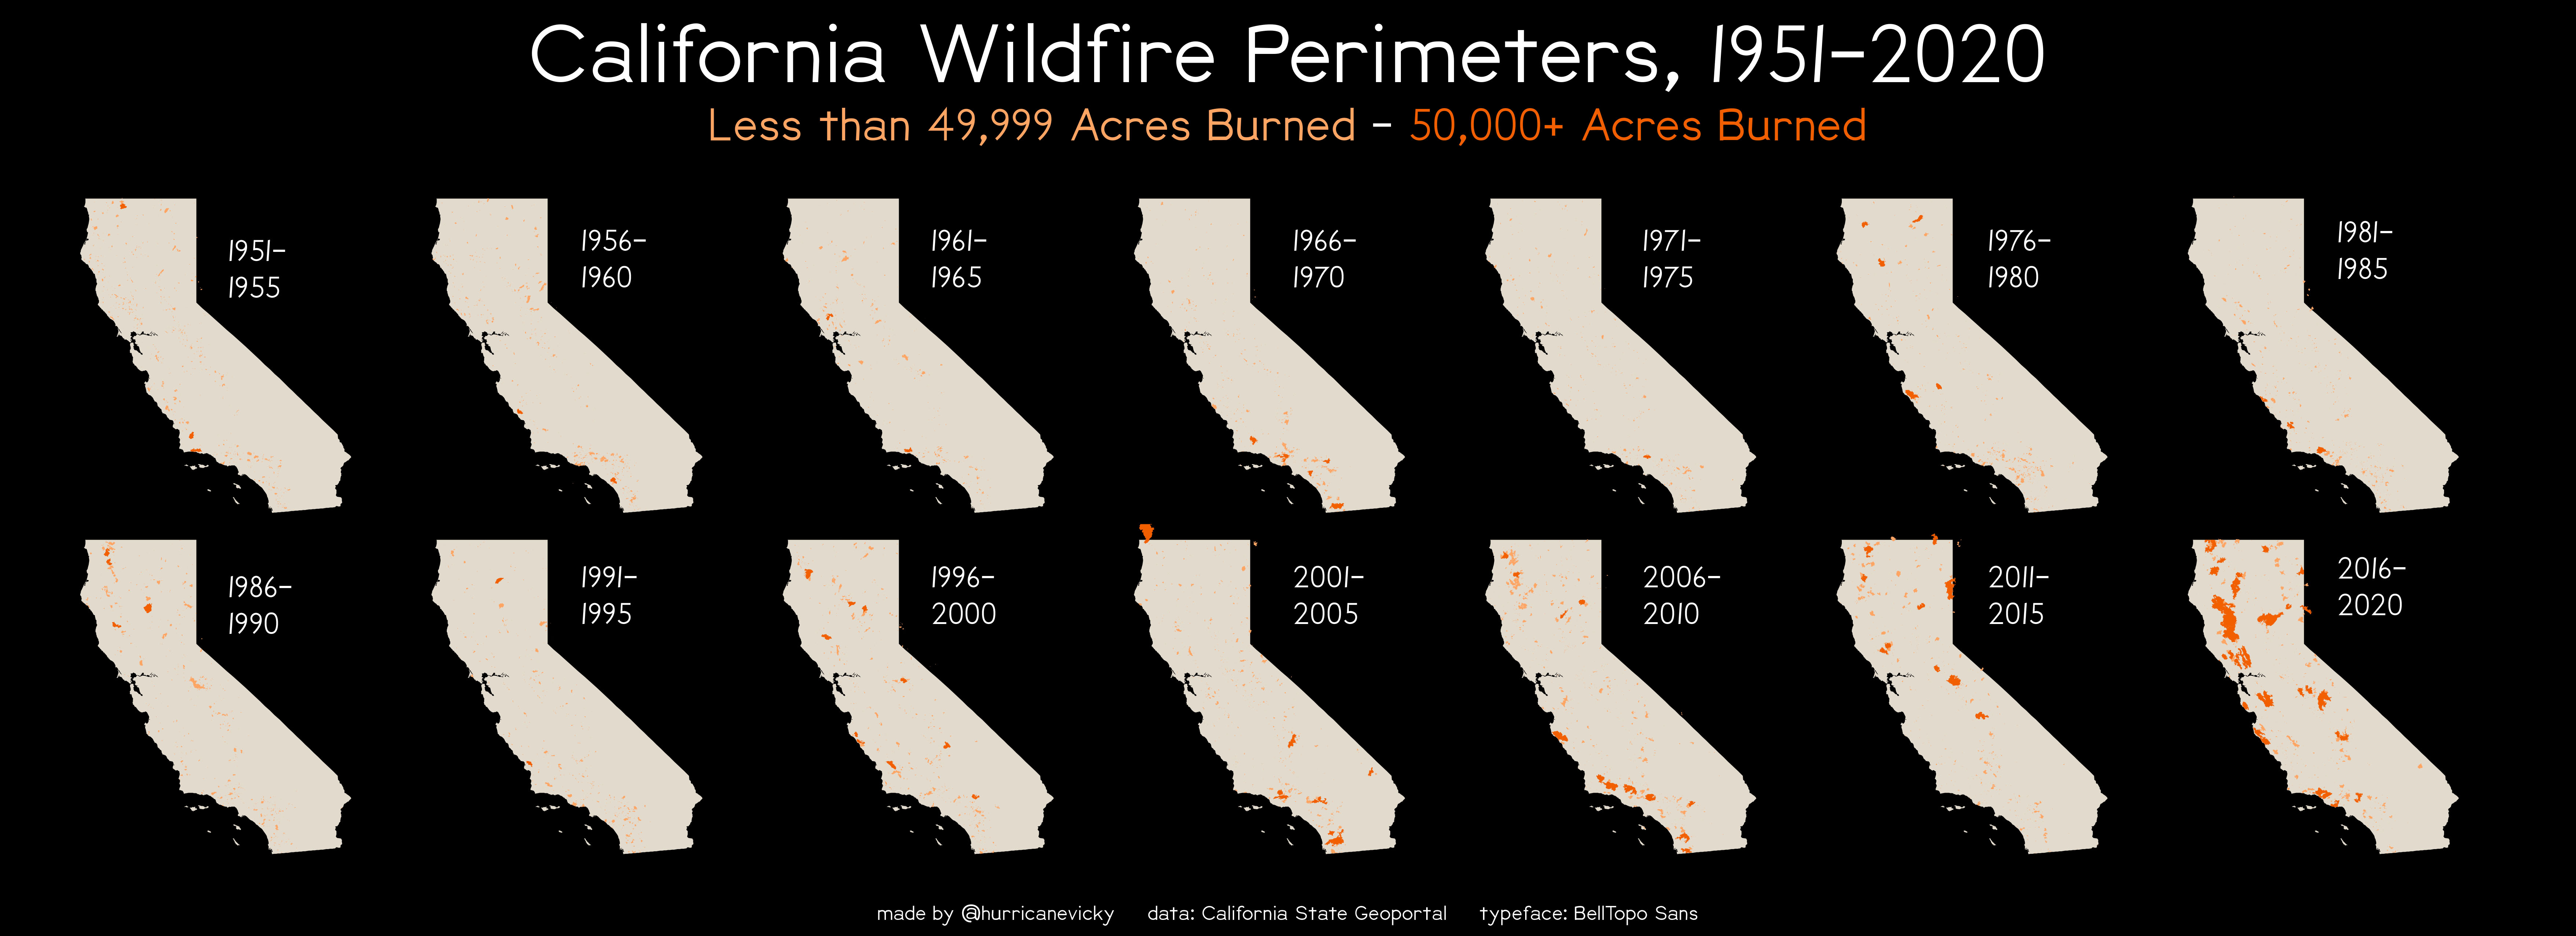 For the challenge’s climate change day, I mapped the past 70 years of wildfires in California, five years at a time. Not much to say here. Bleak. This map is more detailed than it appears at first glance, clicking the image will open it larger in a new tab.
Data from the California State Geoportal and Natural Earth. Typeface is BellTopo Sans.
November 13: Raster
 The growing beige blob upper left center of this gif is the Kutupalong refugee camp near Cox’s Bazar in Bangladesh, just over the border with Myanmar. Though it’s technically been there since 1991, it exploded in growth as the Rohingya population fled following a series of attacks in August 2017 and by 2018 it was (still is) the world’s largest refugee camp. The gif was made with Landsat imagery in Google Earth Engine, here is a slightly more nuanced (but label-less, I was tired) video.
November 12: Map Made Without GIS Software
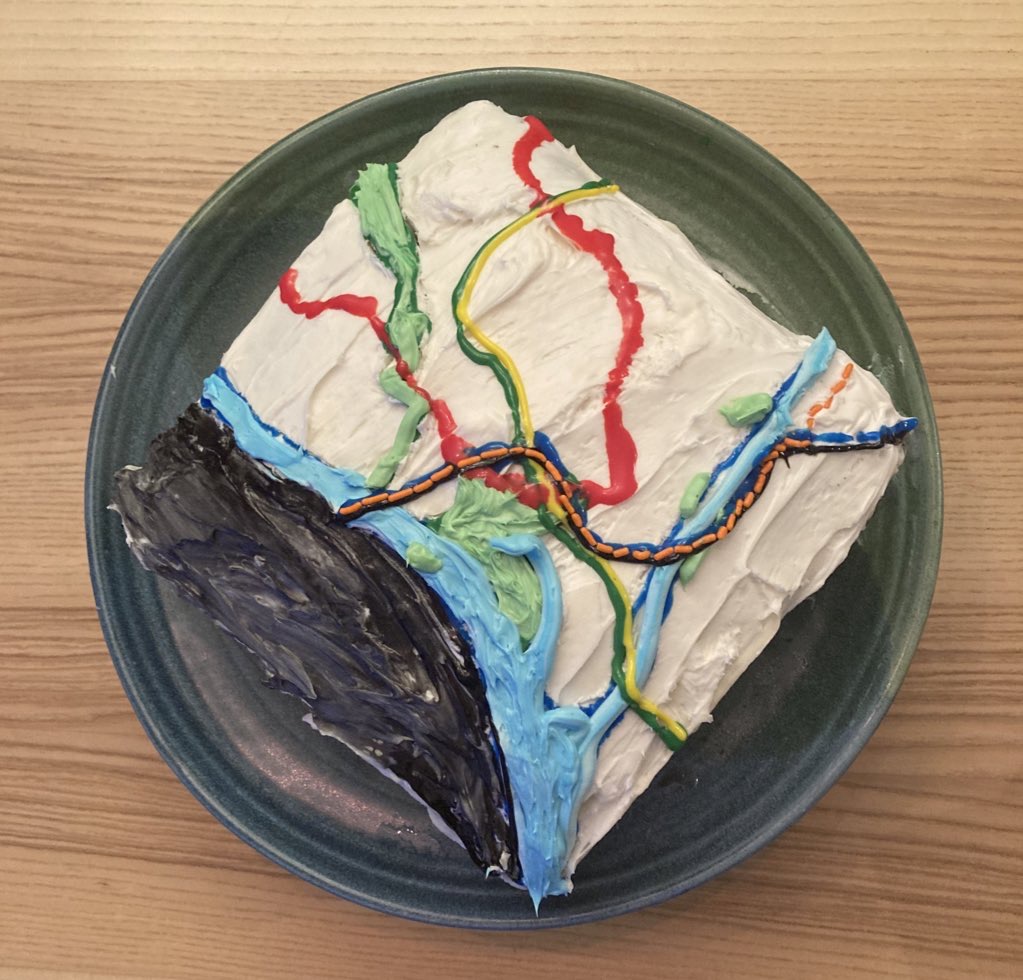 This is a chocolate layer cake with cherry filling in between the layers, decorated with the DC metro map. There are some errors, even though I was looking at a metro map while doing it. ¯_(ツ)_/¯
November 11: 3D
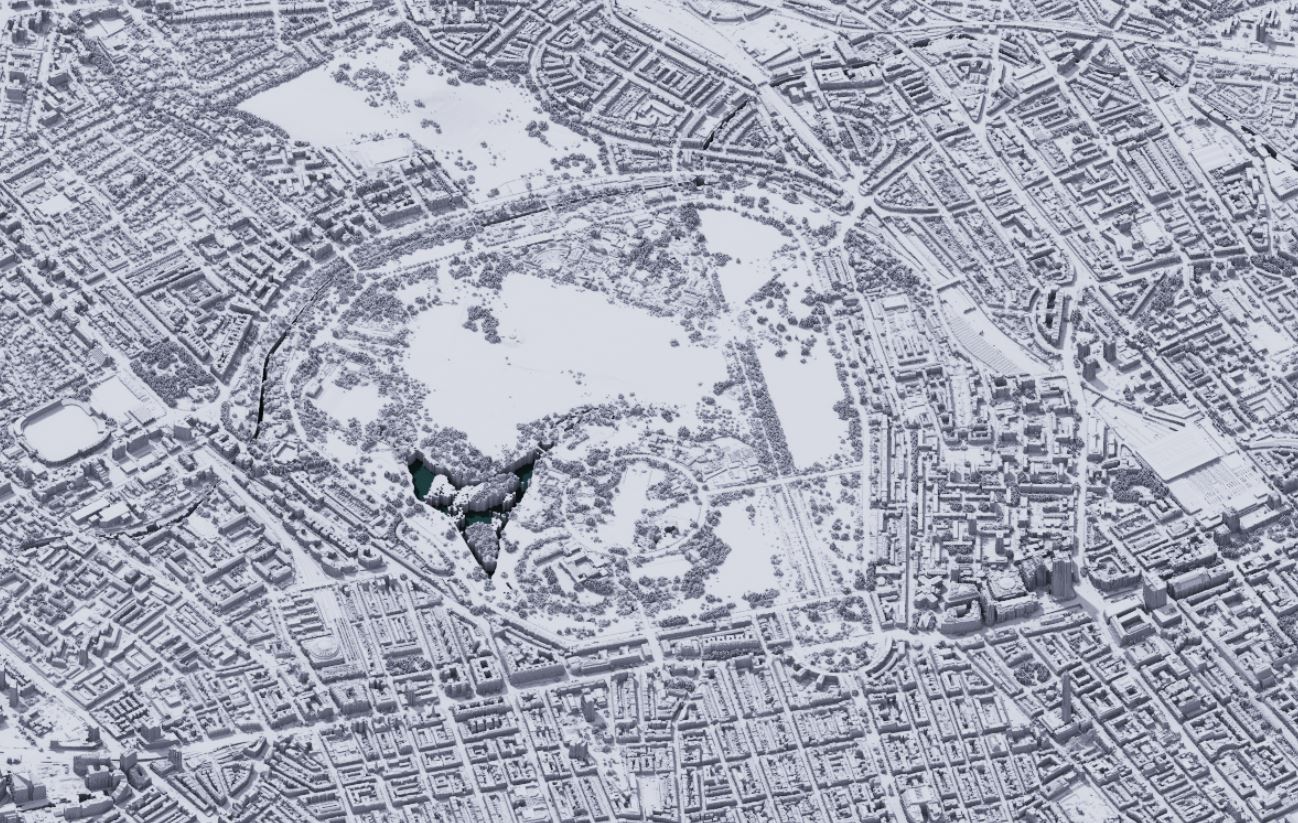
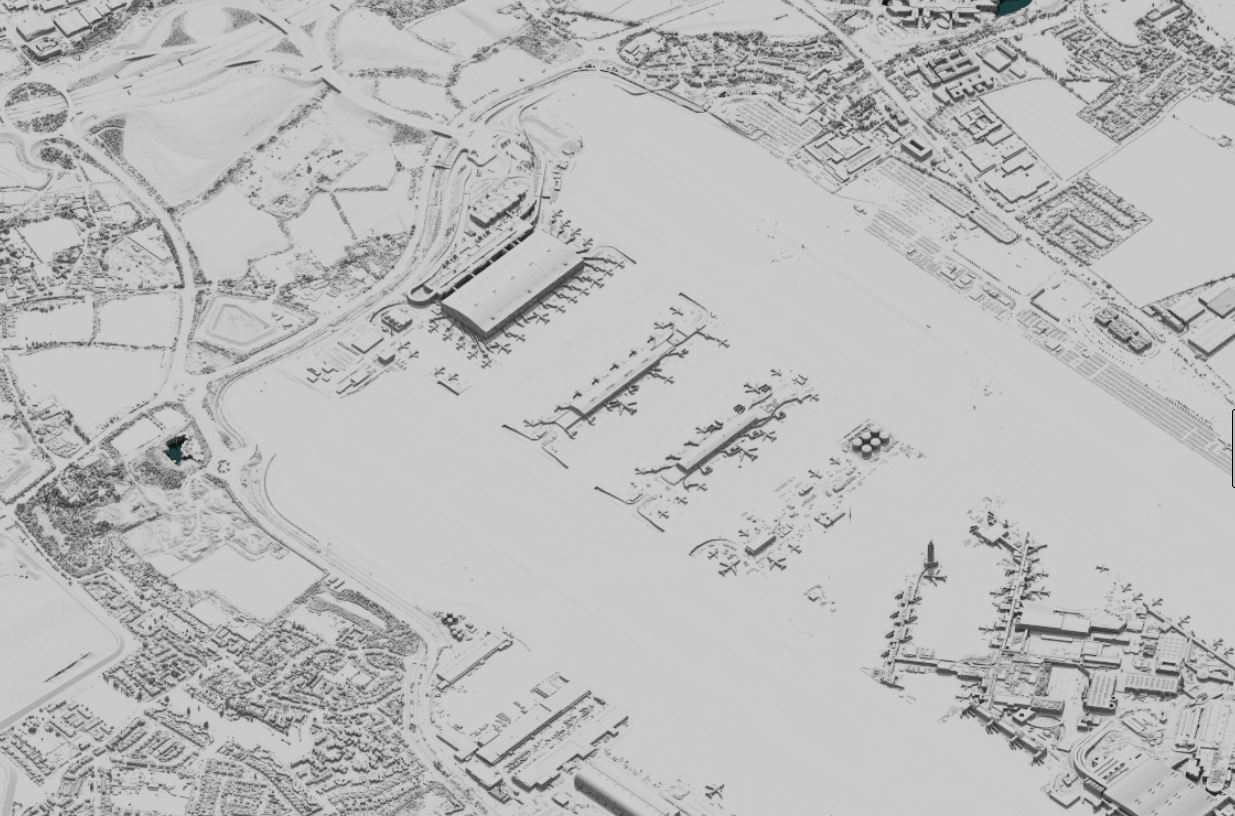
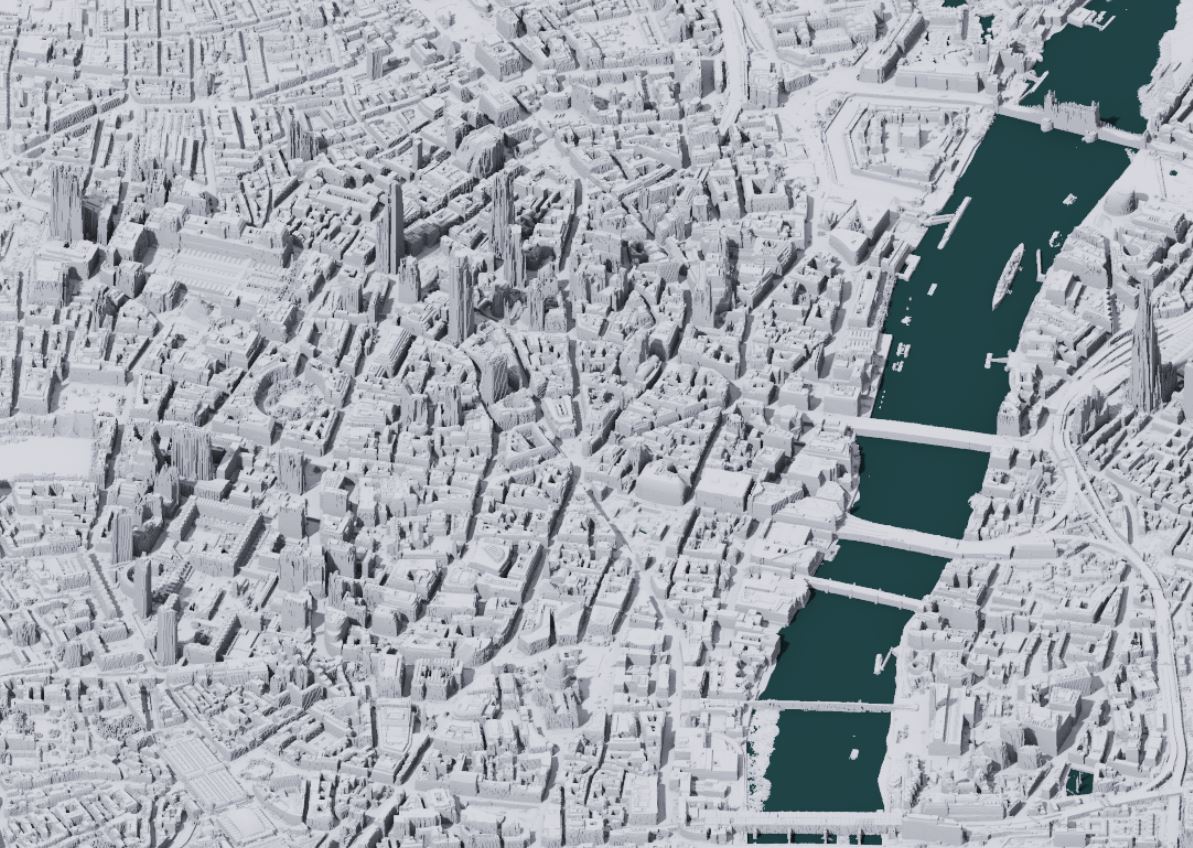 Not a lot of 3D maps in my current role so I took the opportunity to try out a new piece of software, AerialOD, after seeing it all over the Challenge hashtag. It’s a neat program, very powerful, and somewhat Blenderesque. I grabbed some LIDAR from the UK Department of Environmental Food and Rural Affairs’ website and just sort of messed around until I got something that looked all right (Alisdar Rae’s intro to the program was KEY).
The above image is looking east-ish over St Paul’s Cathedral and the City, and below are two more, showing a view northnorthwestish over Regent’s Park and northwestish over Heathrow, just so cool that the LIDAR is so detailed you can make out individual planes!
 Data from DEFRA.
November 10: Grid
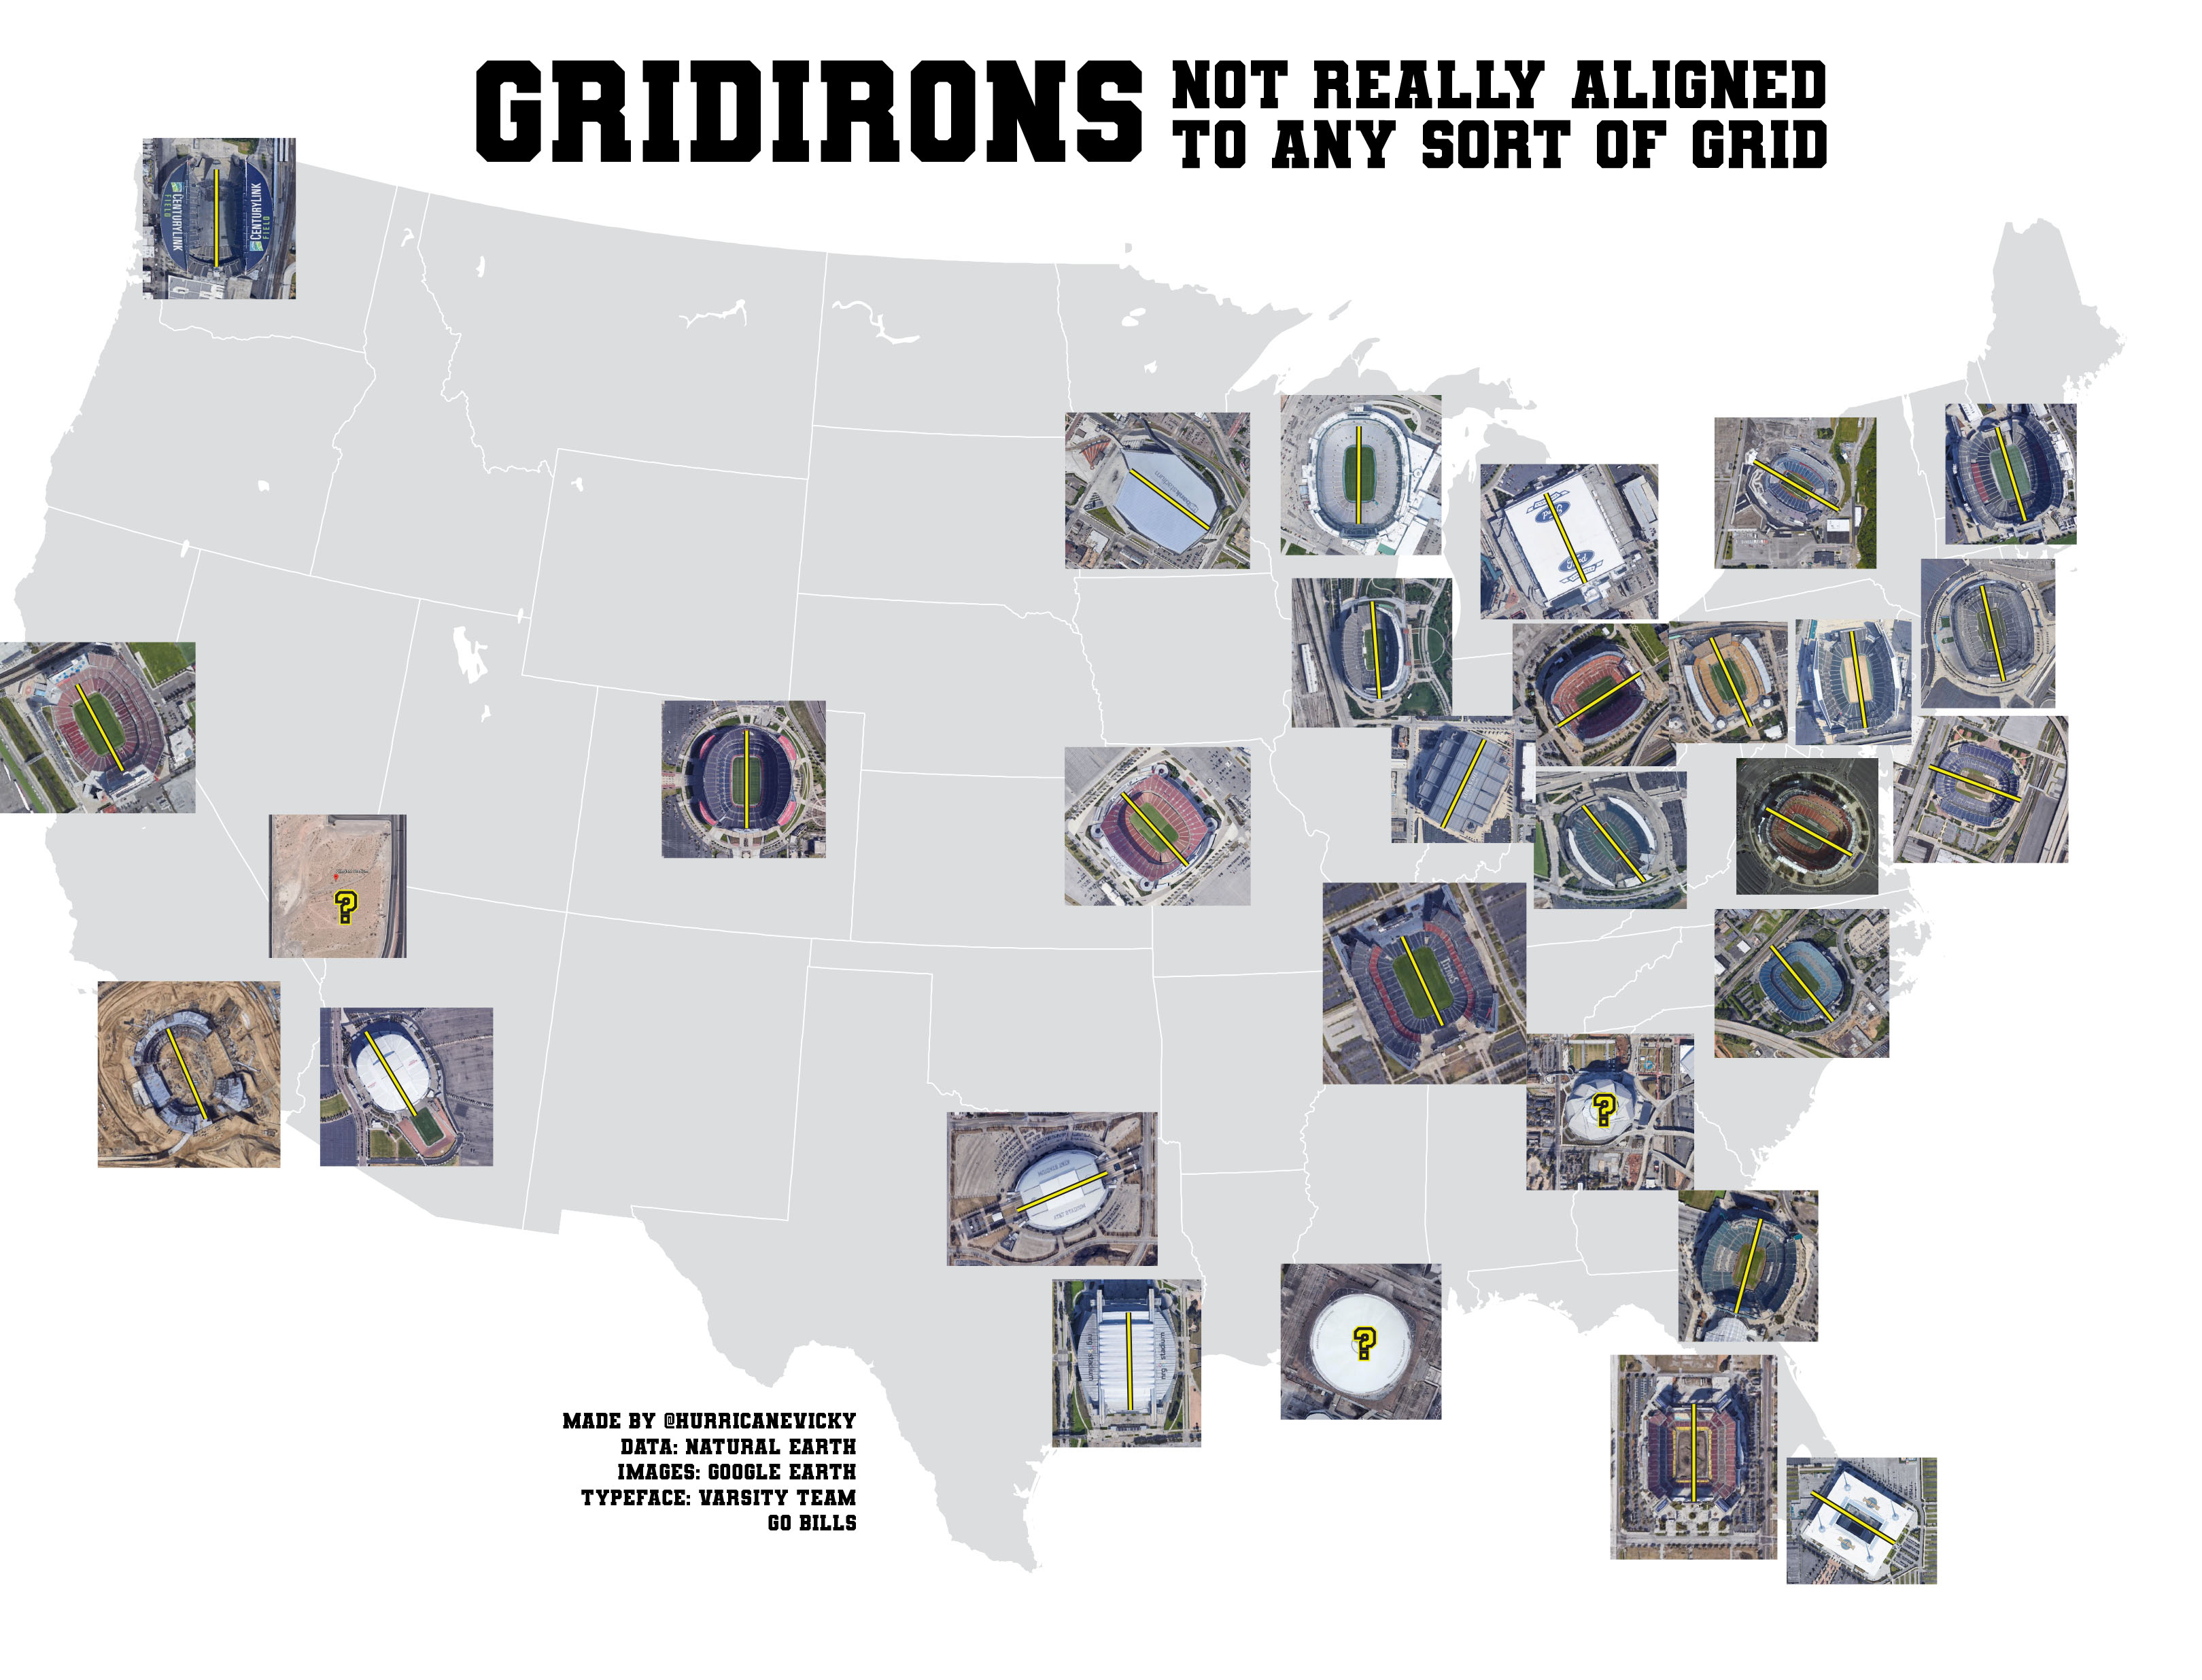 I had oral surgery this morning and just wasn’t feeling the grid theme or putting much energy into anything other than crawling back into bed, so I went in another direction and did grid…iron orientations. I thought there might be some patterns or something evident here. Nope! Not really. Question marks are domes where orientation was unclear (the Las Vegas Raiders’ dome wasn’t built yet at the time google earth’s image was taken, which is fine because that dome doesn’t open).
![]() unlabeled version, the lines are clearer.
unlabeled version, the lines are clearer.
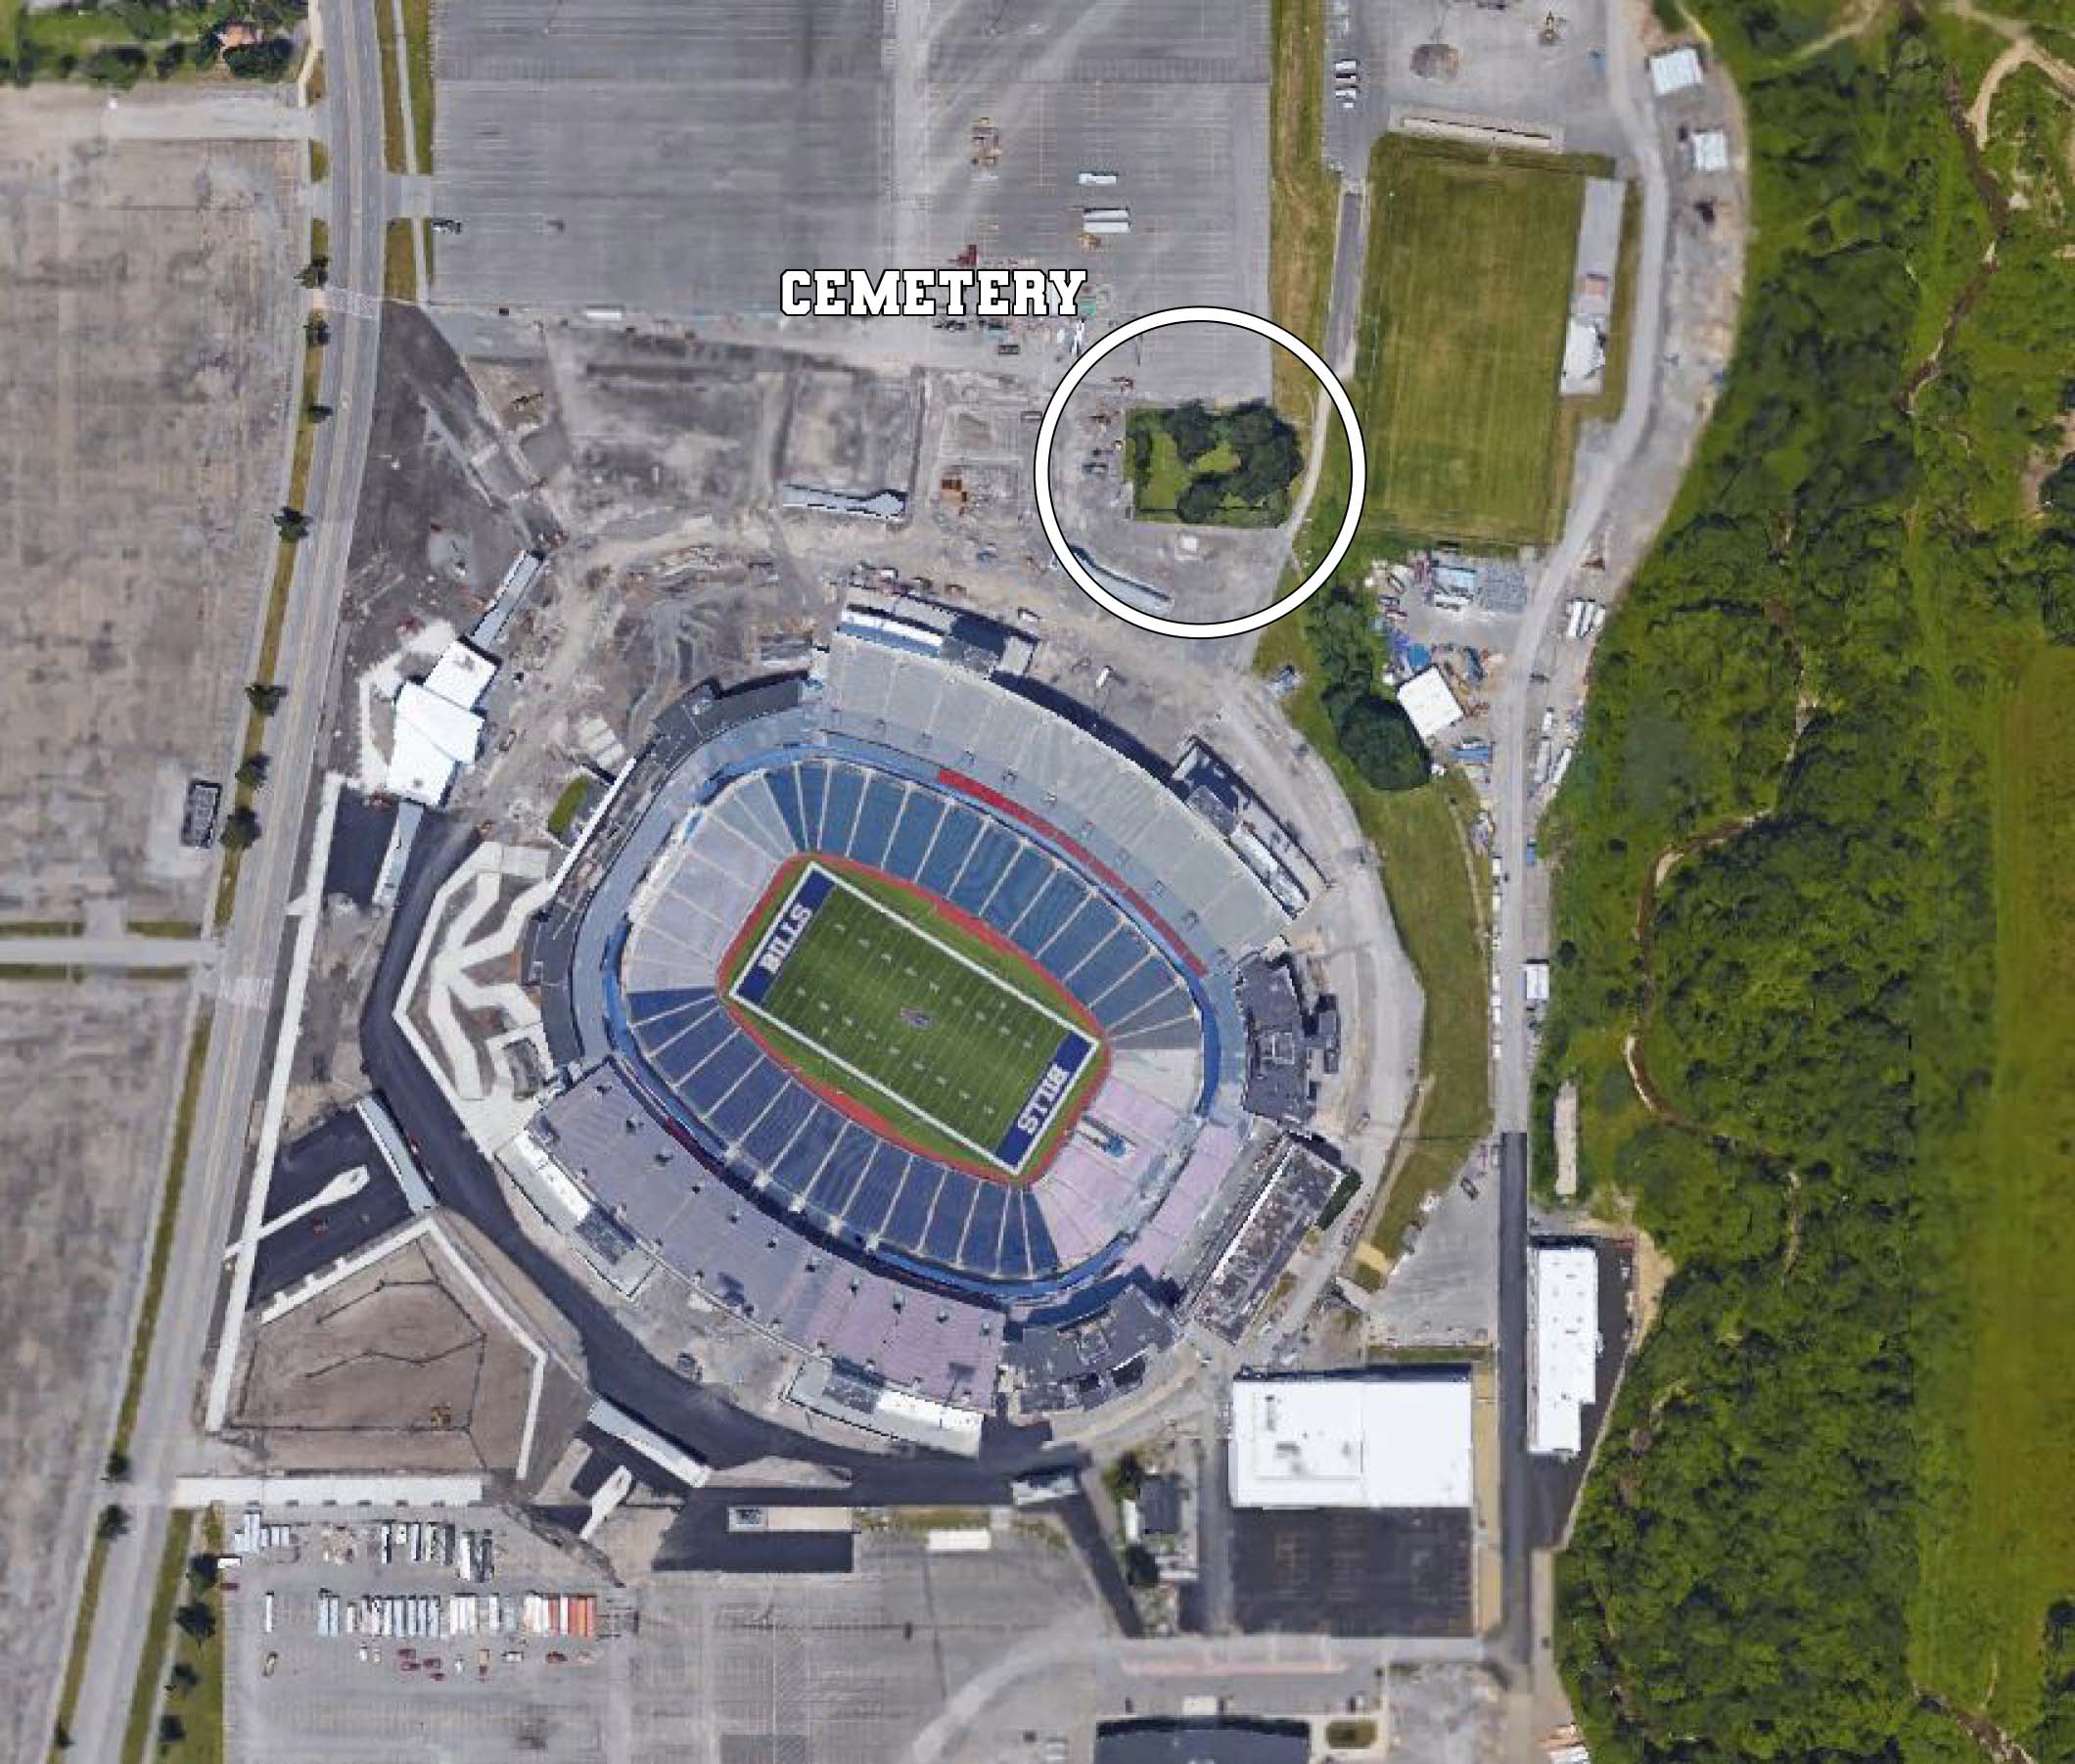
I also thought the Bills’ stadium might stick out more. The stadium was built on land that includes a cemetery,
and the descendents of those interred there refused to allow the graves to be moved (this is not a Poltergeist situation, the headstones are still there). As a result, the stadium was not constructed North-South as originally planned but on a more East-West tilt, which allows for a vicious crosswind off Lake Erie (3.75 miles due west) to keep Bills fans’ beers extra chilly. Also sometimes the wind affects the ball trajectory. And maybe the cemetery’s proximity means the team is cursed.
Images are screenshots from Google Earth, states from Natural Earth. Typeface is Varsity Team from dafont.
November 9: Monochrome
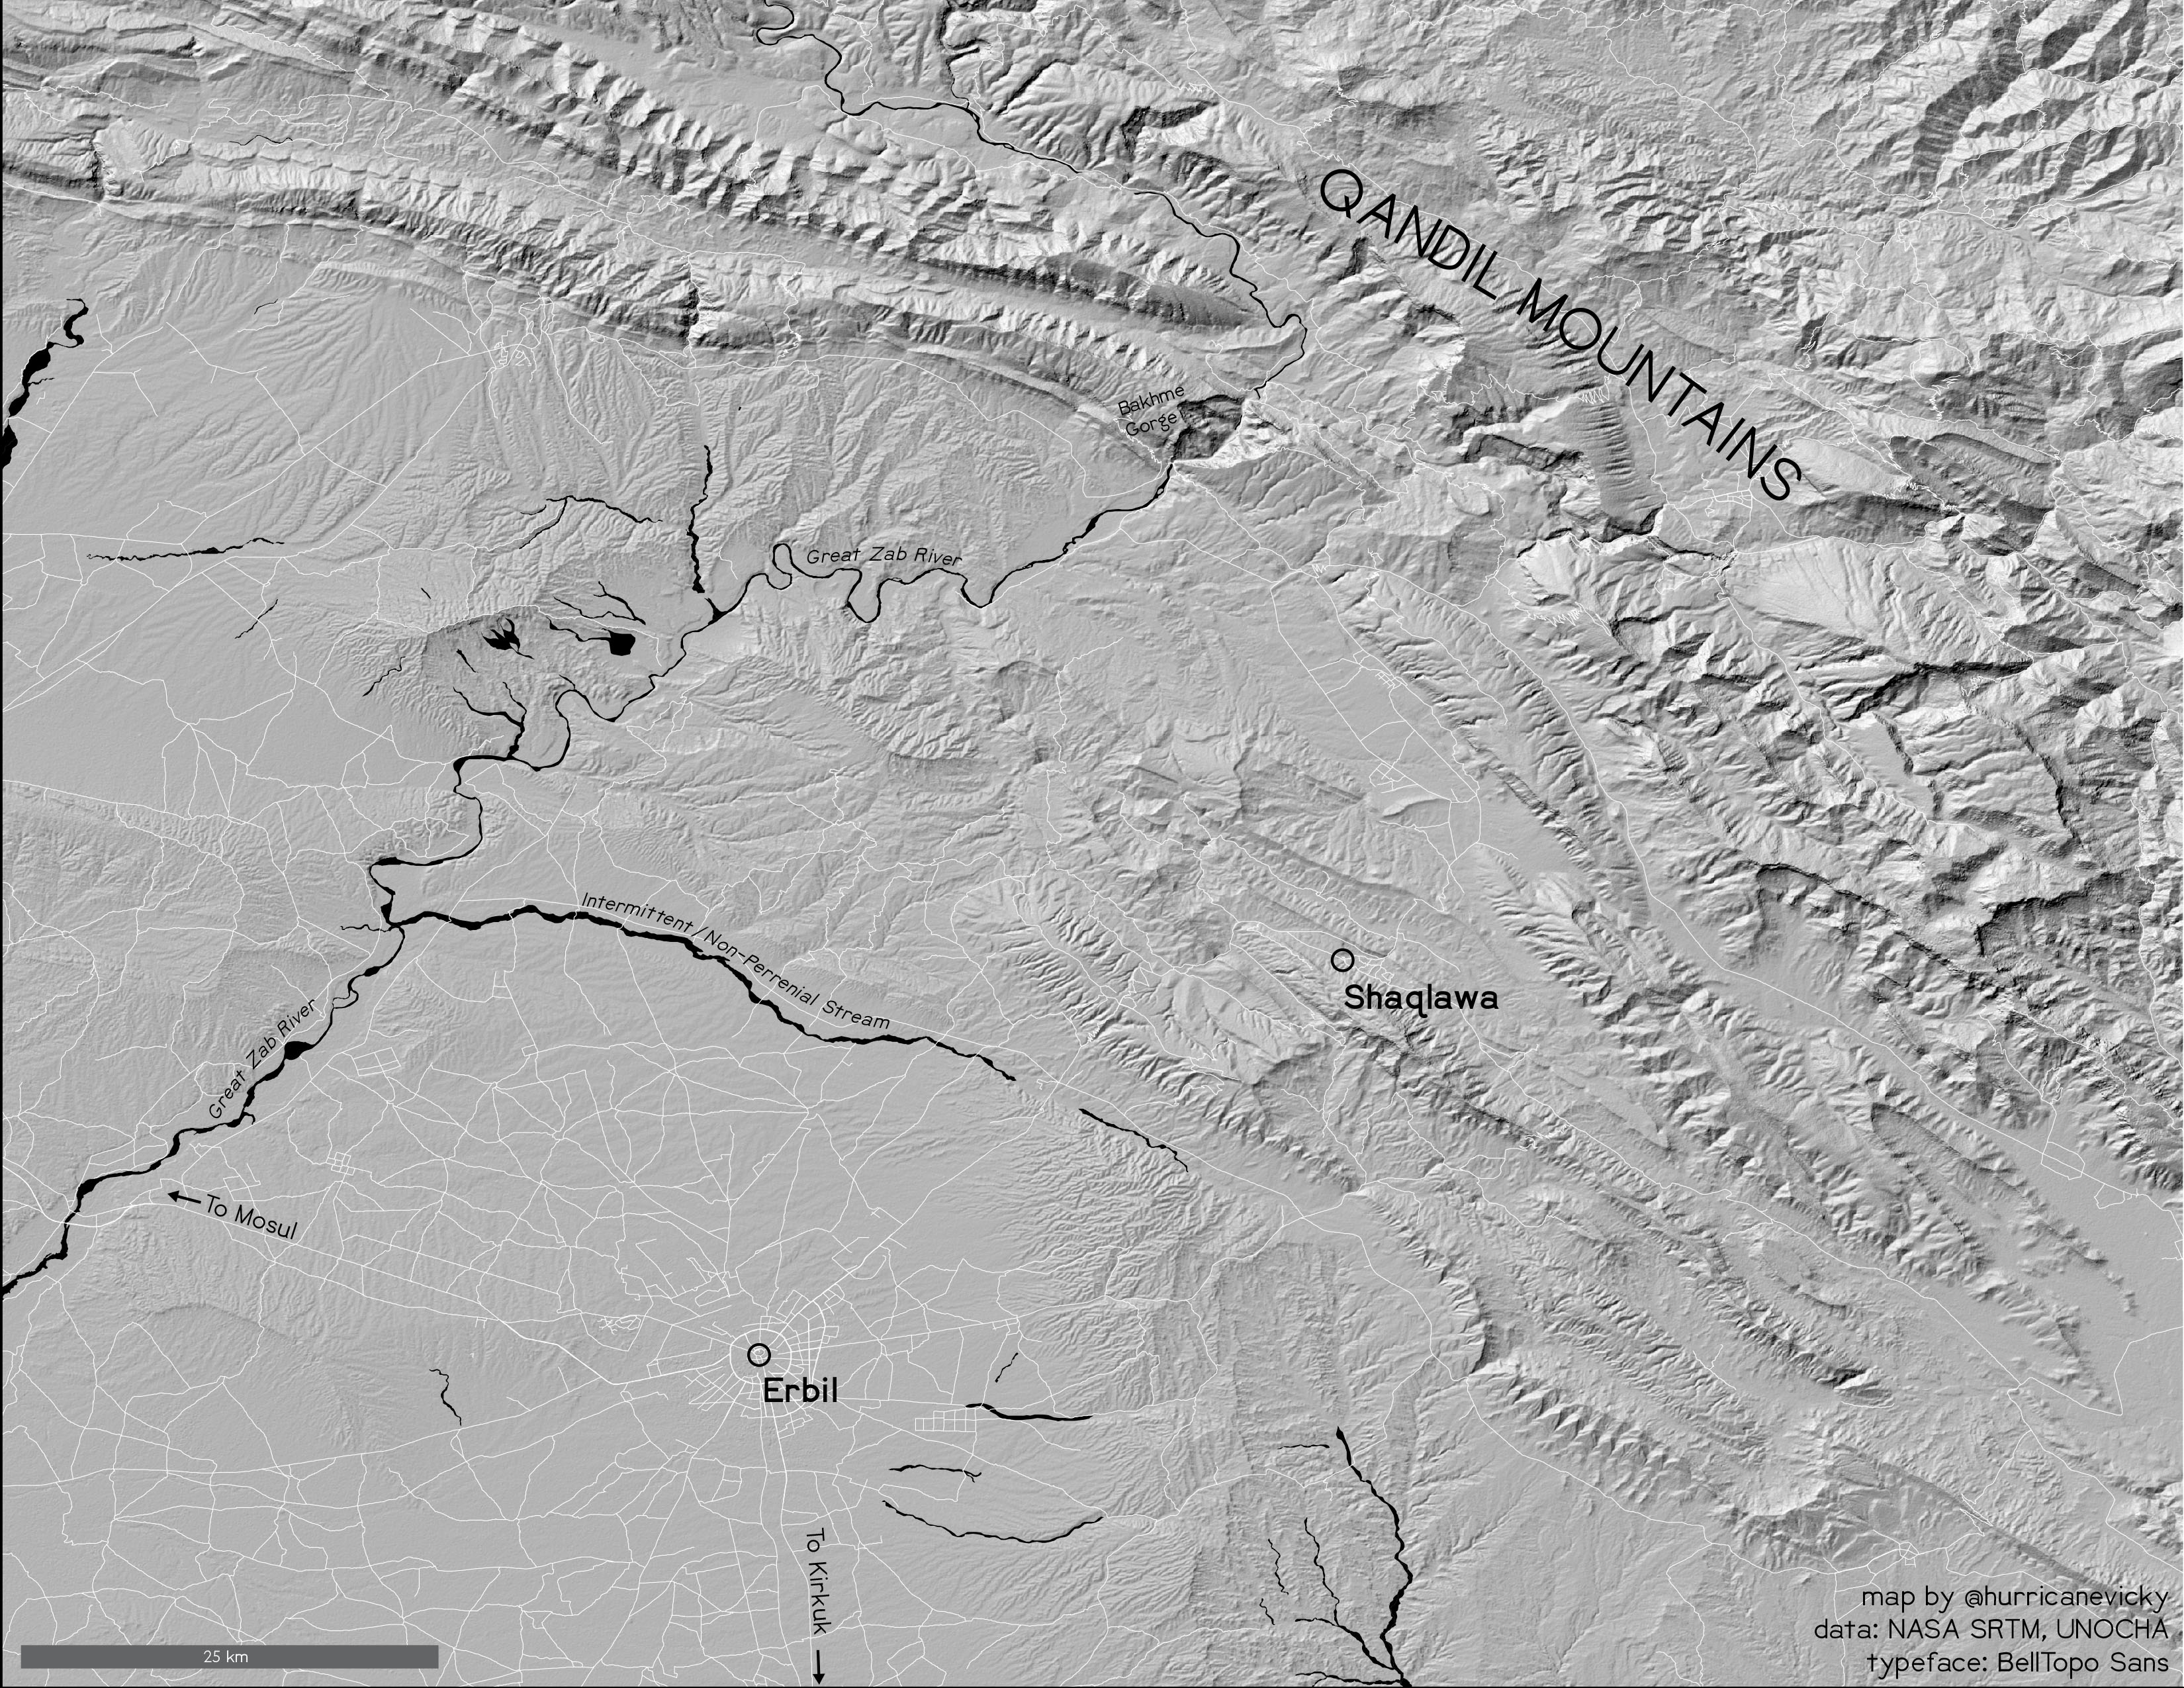
Most of my maps for the challenge are pretty simple and straightforward, this one might need a bit more explanation. I’m not great at monochrome mapping, stylistically speaking (I love clashing colors, the more garish the better) so I thought it best to lean on terrain mapping, where a gradient hillshade can do most of the heavy lifting.
Deciding what landscape to map, then, I found myself wondering if the Erbil Citadel would show up as terrain. The Citadel is an 80- to 100-foot high tell in the center of Erbil, the capital of the Kurdish Autonomous Region of Iraq. It looks like this on Google Earth
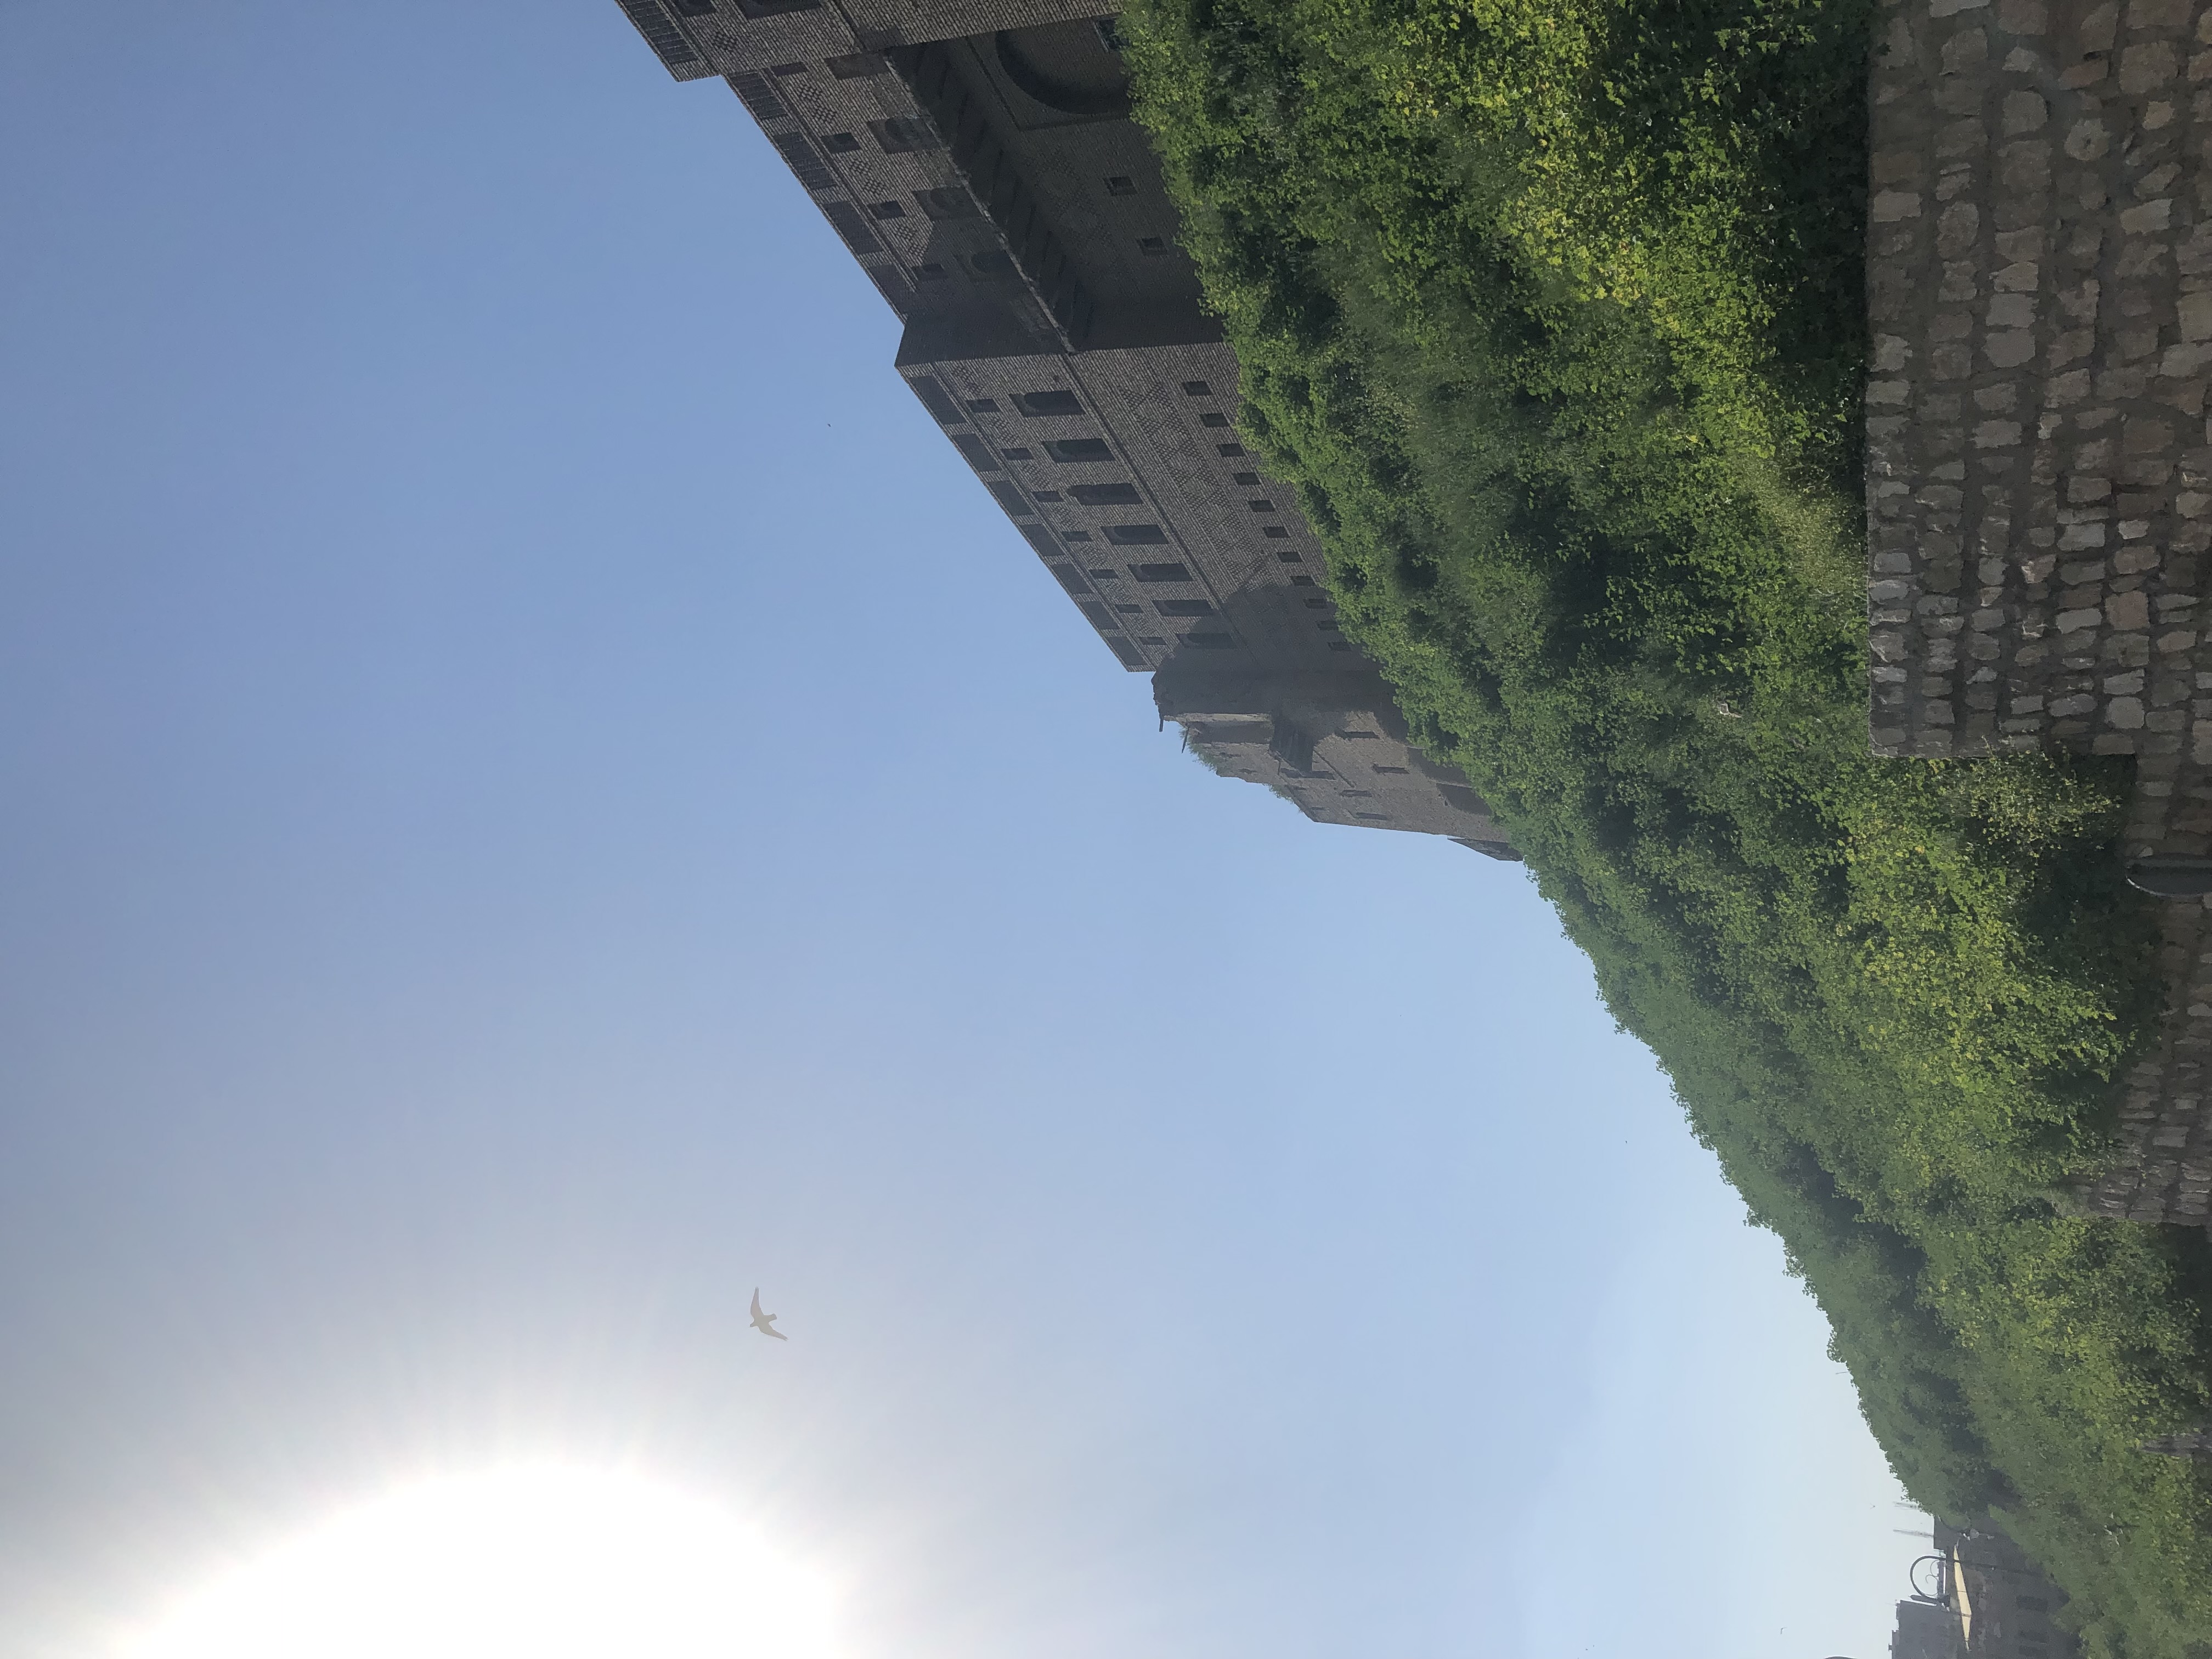
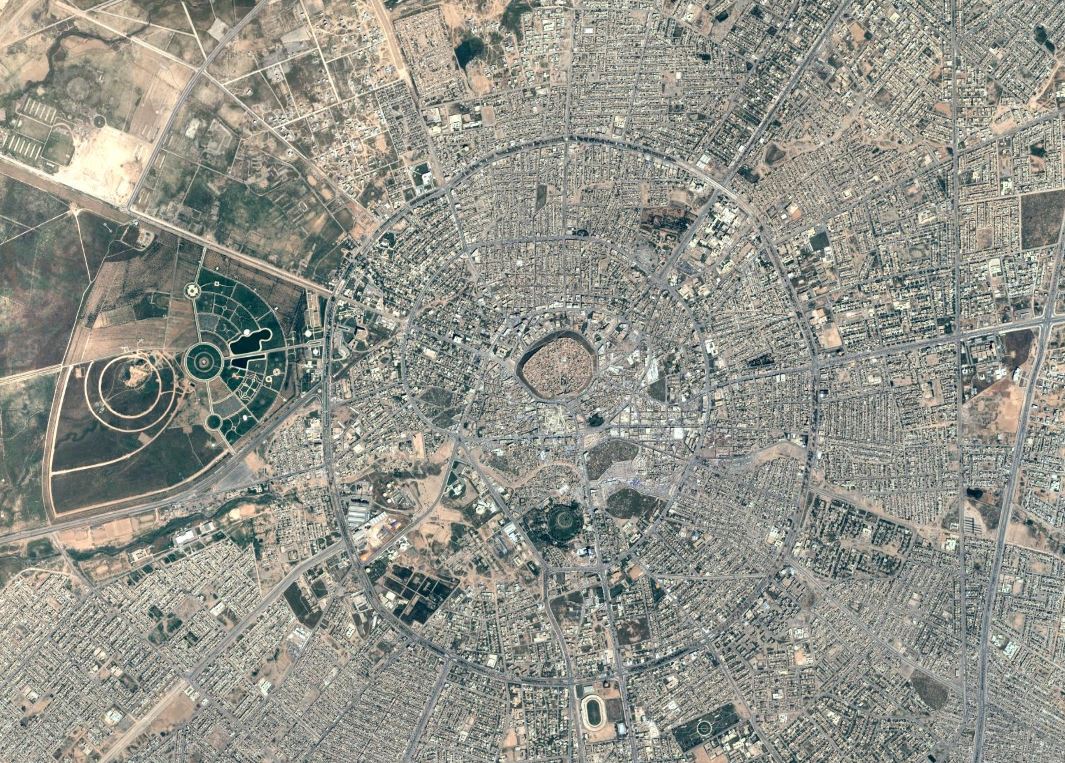 and like this from the ground. I can’t speak for the entire country but this part of Iraq is a lot more green that it appears from above (or on cable news).
 Tells are almost like artificial terrain - they’re formed from centuries of people living, building and re-building, in the same spot. The tell at the center of Erbil is thought to be the longest continually occupied human settlement - people have lived there for over 6,000 years. Though it’s mostly a tourist attraction these days (as well as a UNESCO World Heritage site), some folks do still live up there.
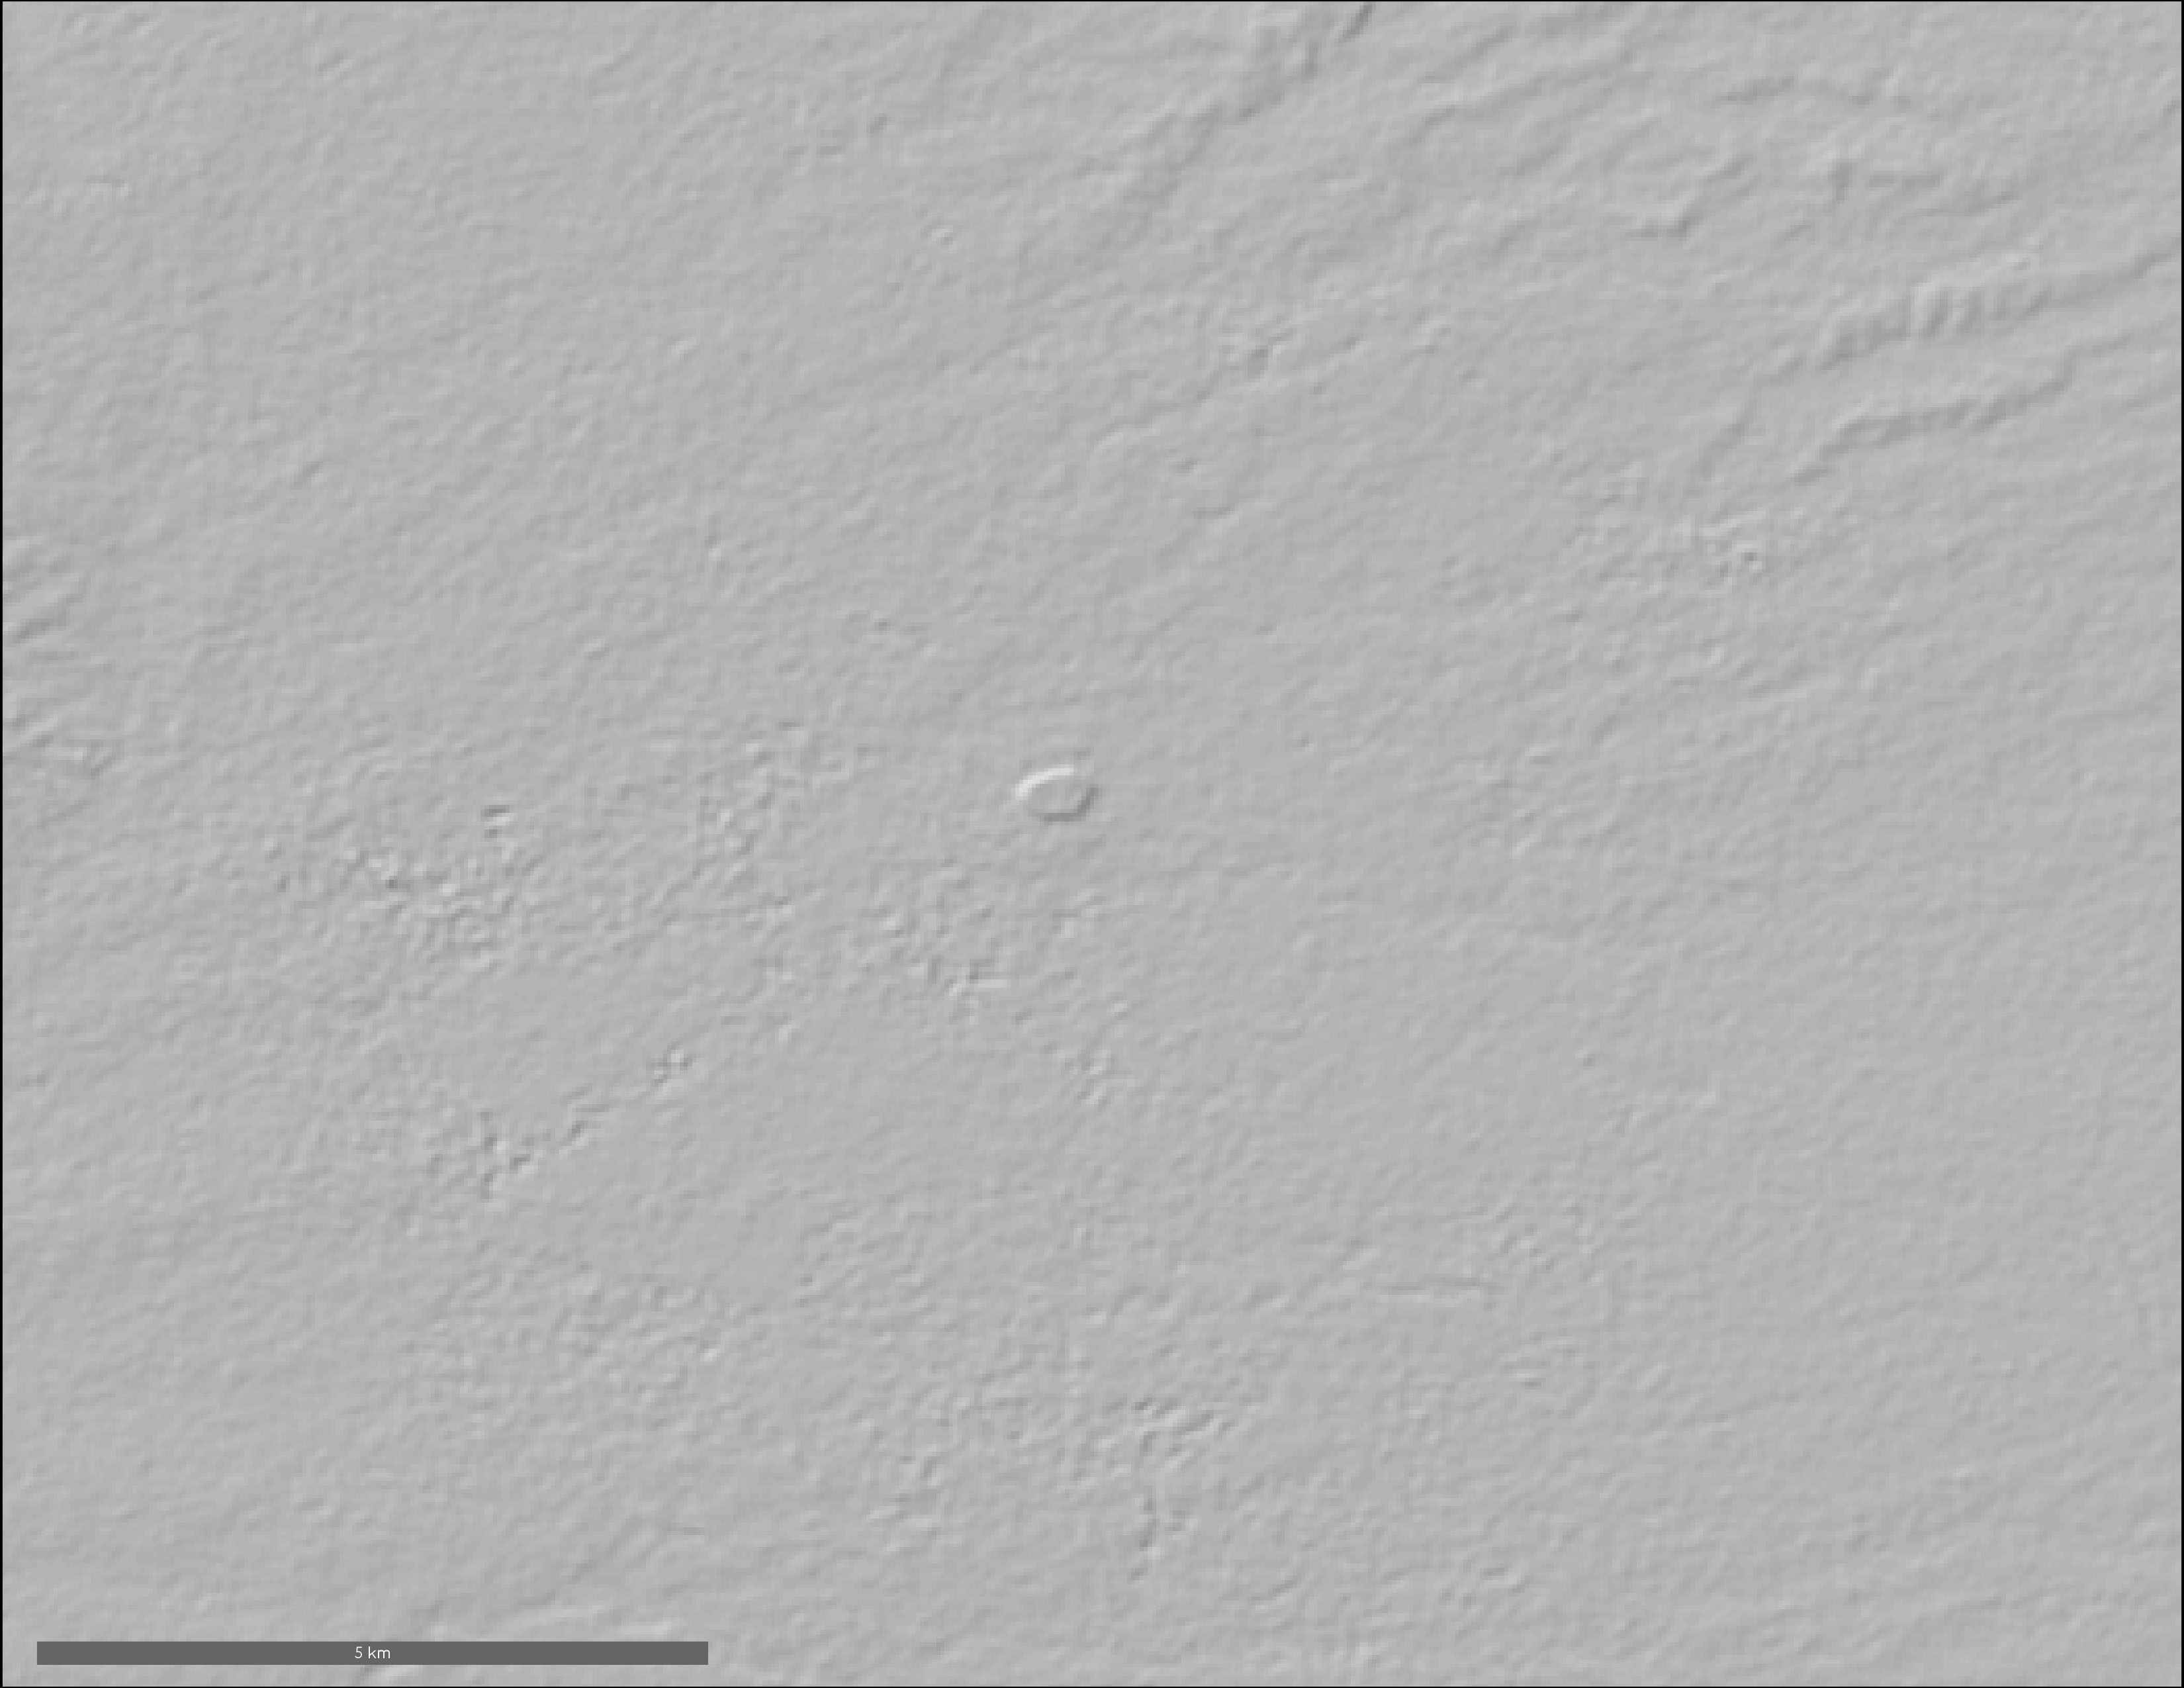
So yeah I was wondering if this tallish, flat-topped, slope-sided hill would be distinct enough from the relatively flat terrain immediately surrounding it to show up in a Shuttle Radar Topography Mission (SRTM) 1 arc second digital elevation model hillshade.
 It does!!!! Here’s a closer look, zoomed way in. Our little friend, like a small out-of-place mesa.
 Question: answered. I then made a little map around it to help give a sense of what’s being shown. I feel like the geography of this area is not as familiar to most folks.
 Et voila.
Data from NASA SRTM and UNOCHA Iraq on Humanitarian Data Exchange. Typeface is BellTopo Sans.
November 8: Yellow
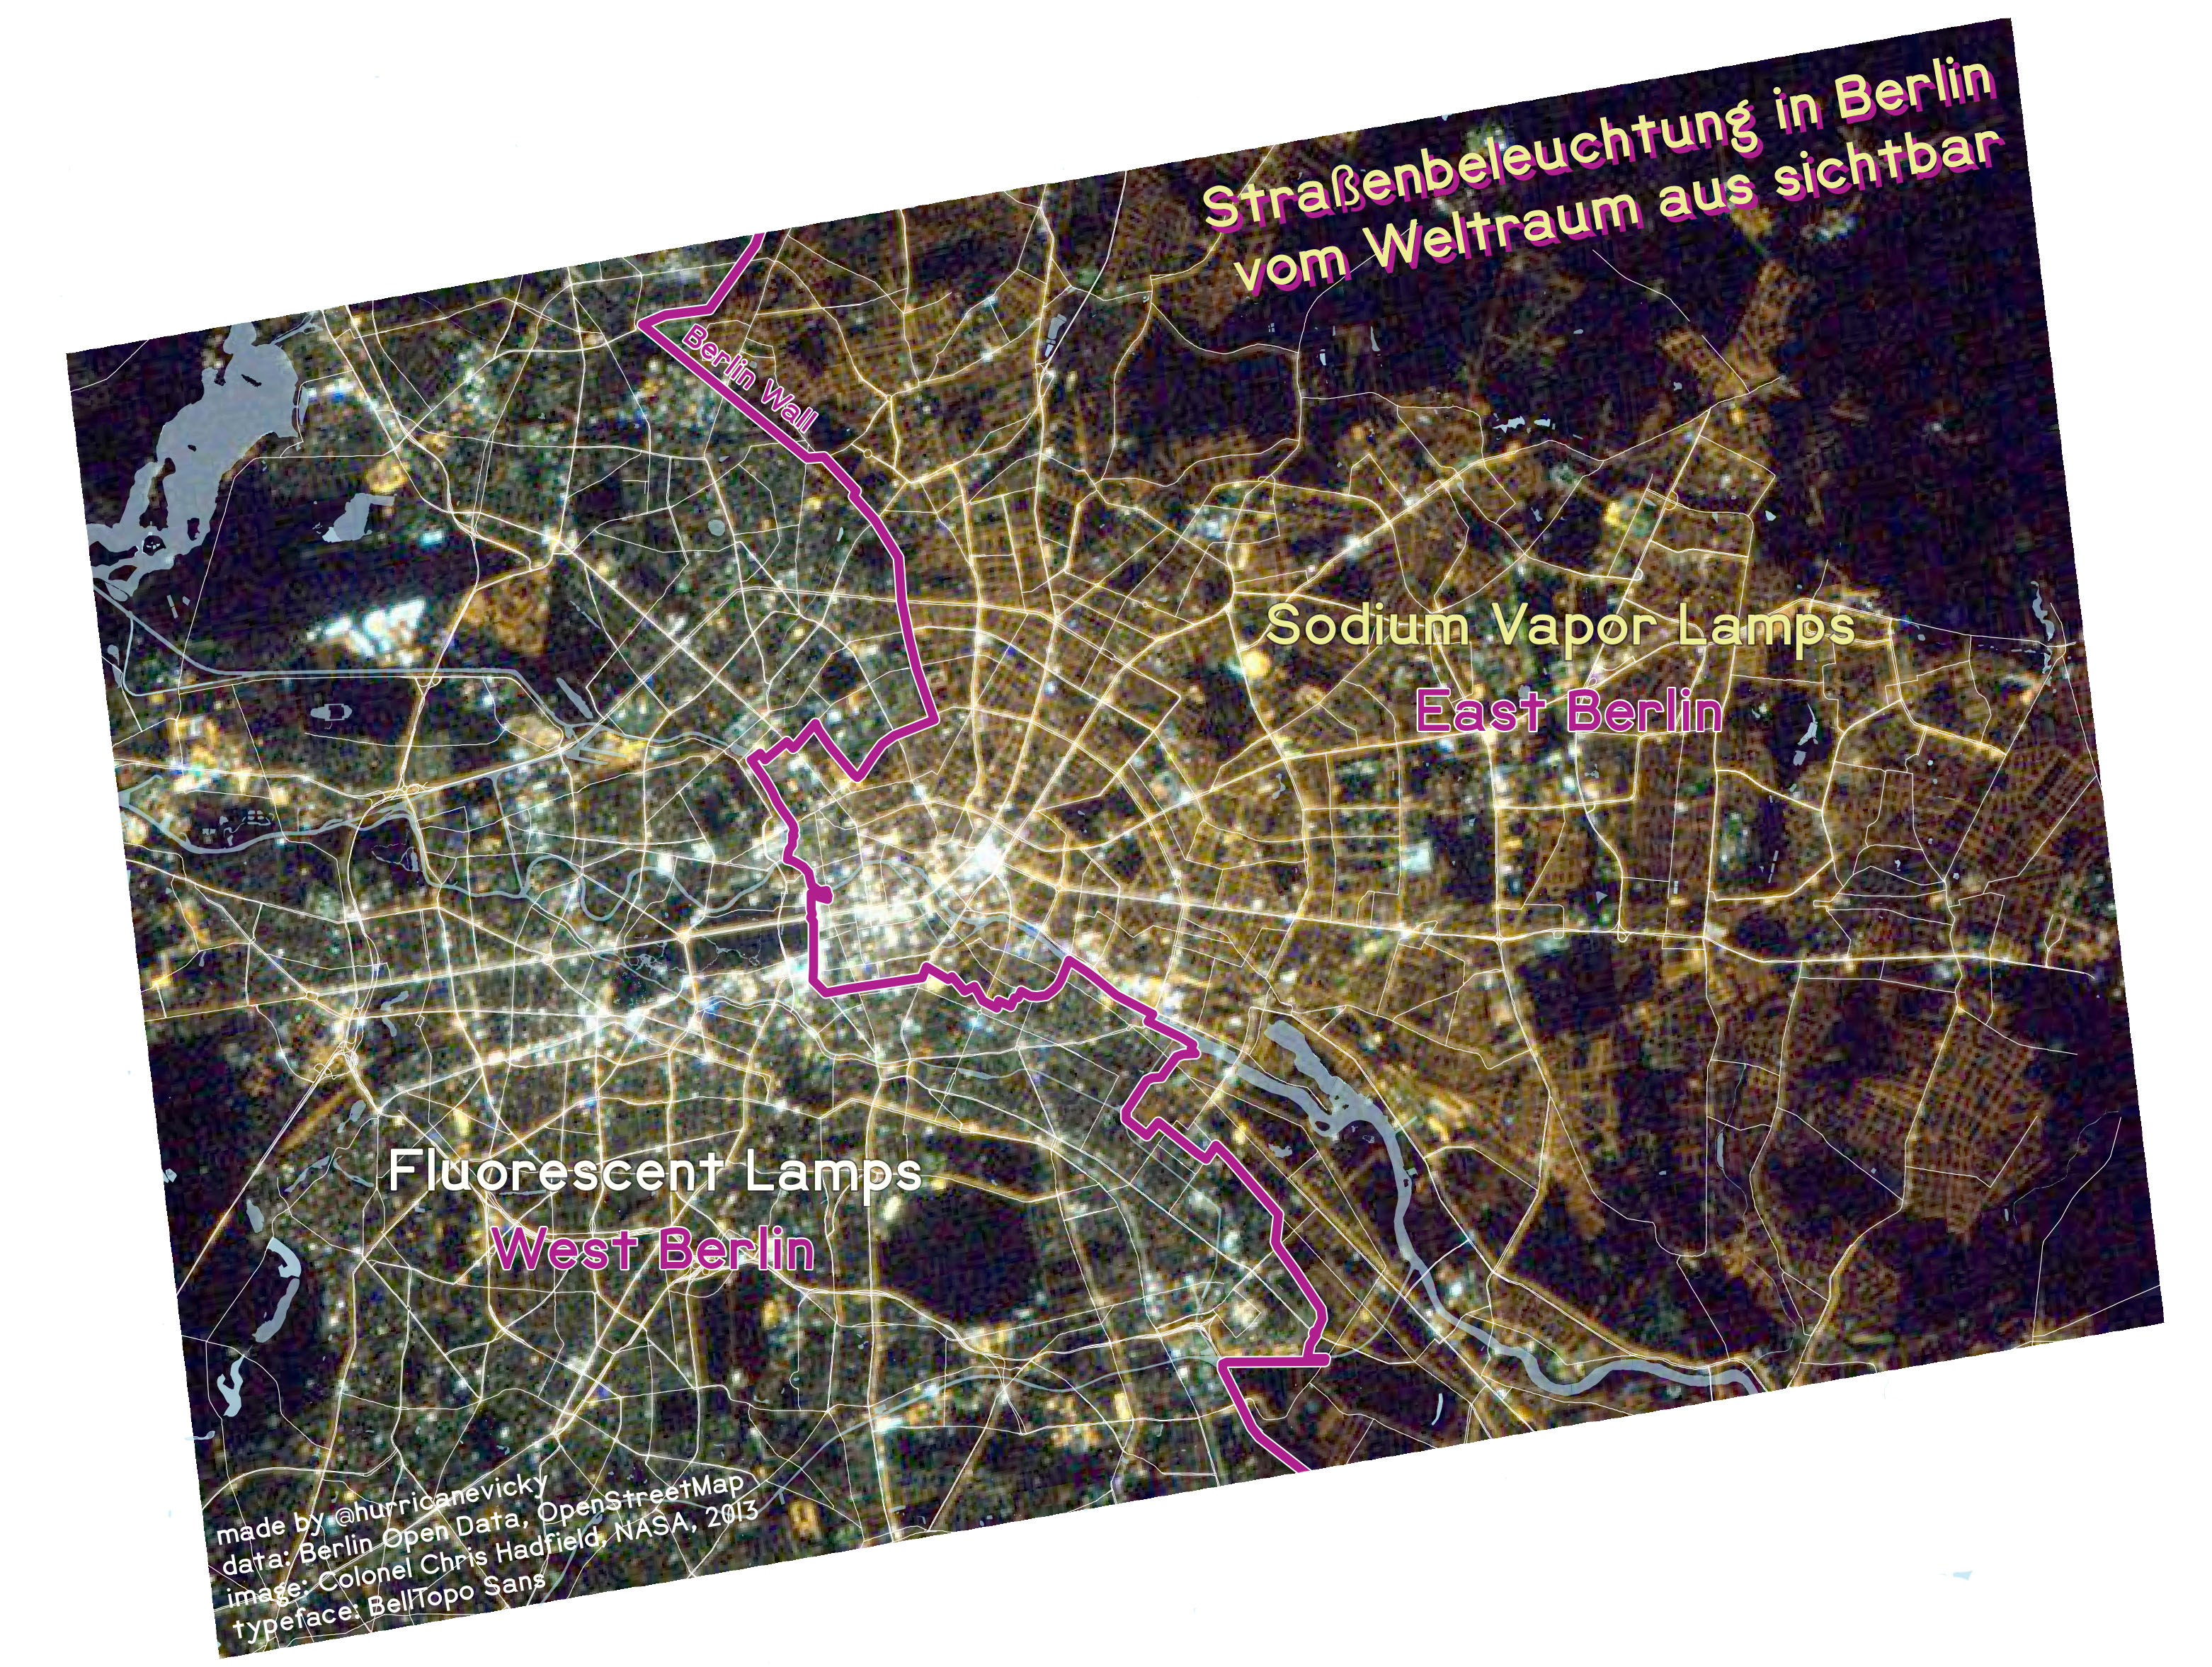 When I saw Dylan’s gorgeous re-creation of flying into (or out of) a city at night, I was immediately reminded of the story from a few years back around Col. Chris Hadfield’s photo of Berlin from space and how, decades after reunification, the city’s divide was literally visible from space in the streetlights. This was a quick one, so it’s not so much a map as a georeferenced and labeled satellite image. Oh well. I still like it.
Data from Berlin Open Data and OpenStreetMap, image from Colonel Chris Hadfield on twitter. Based on what I could translate, I am pretty sure Berlin Open Data has streetlight data, but my German is p much limited to basic conversation and not, like, technical terms. Typeface is BellTopo Sans!
November 7: Green
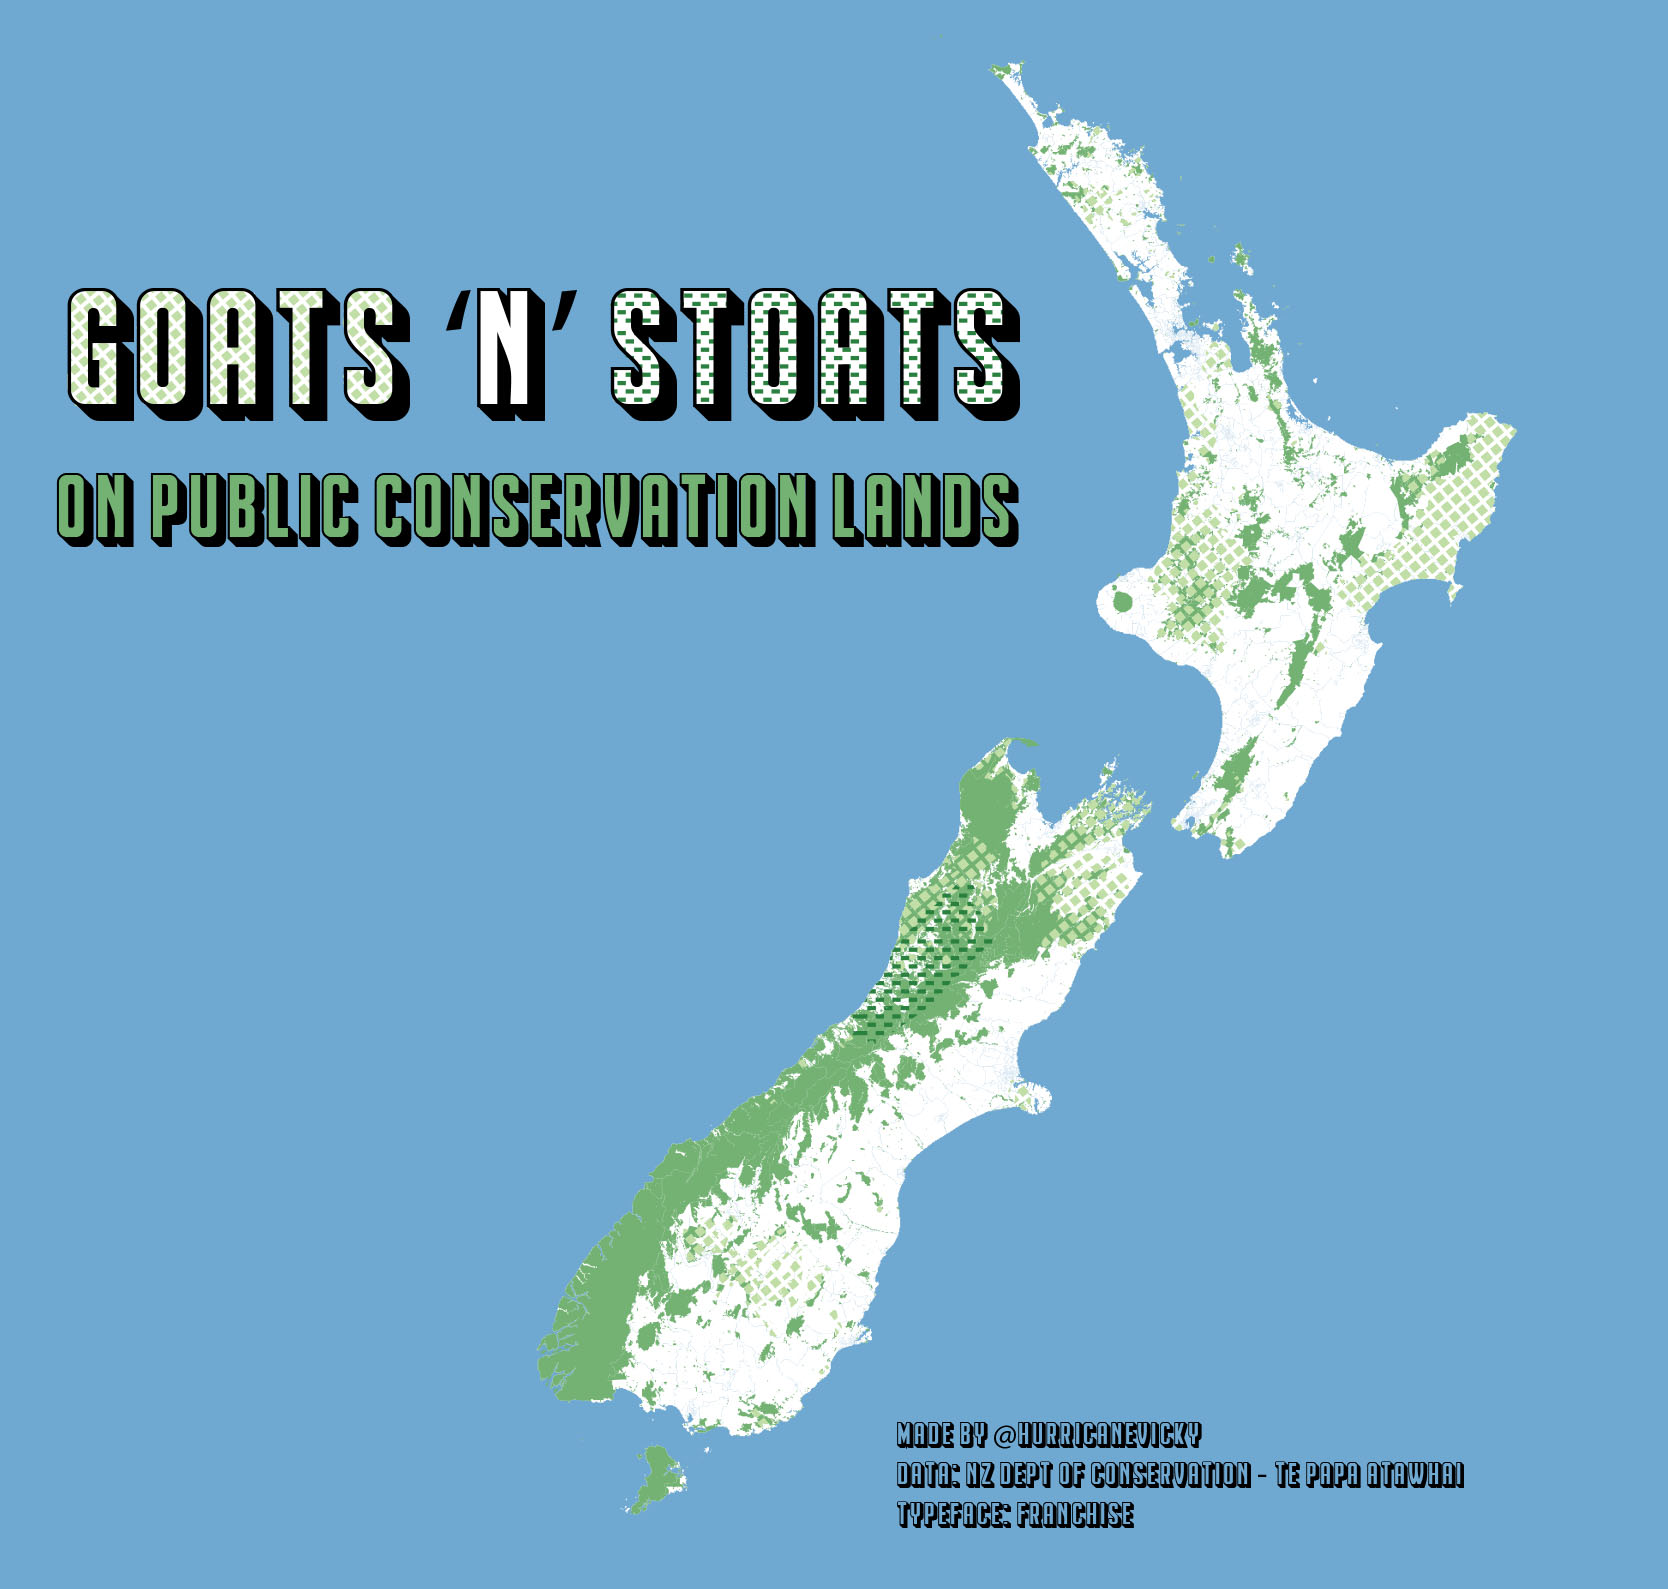 Today’s map plan ground to a screeching halt once I saw that the New Zealand Department of Conservation (I almost typed Department of Conversation, which was a pretty good bar on K Rd like 12 years ago) Te Papa Atawhai collected data on FERAL GOATS AND STOATS.
Data from New Zealand Department of Conservation Te Papa Atawhai and Natural Earth. Typeface is Franchise, also from dafont.
November 6: Red
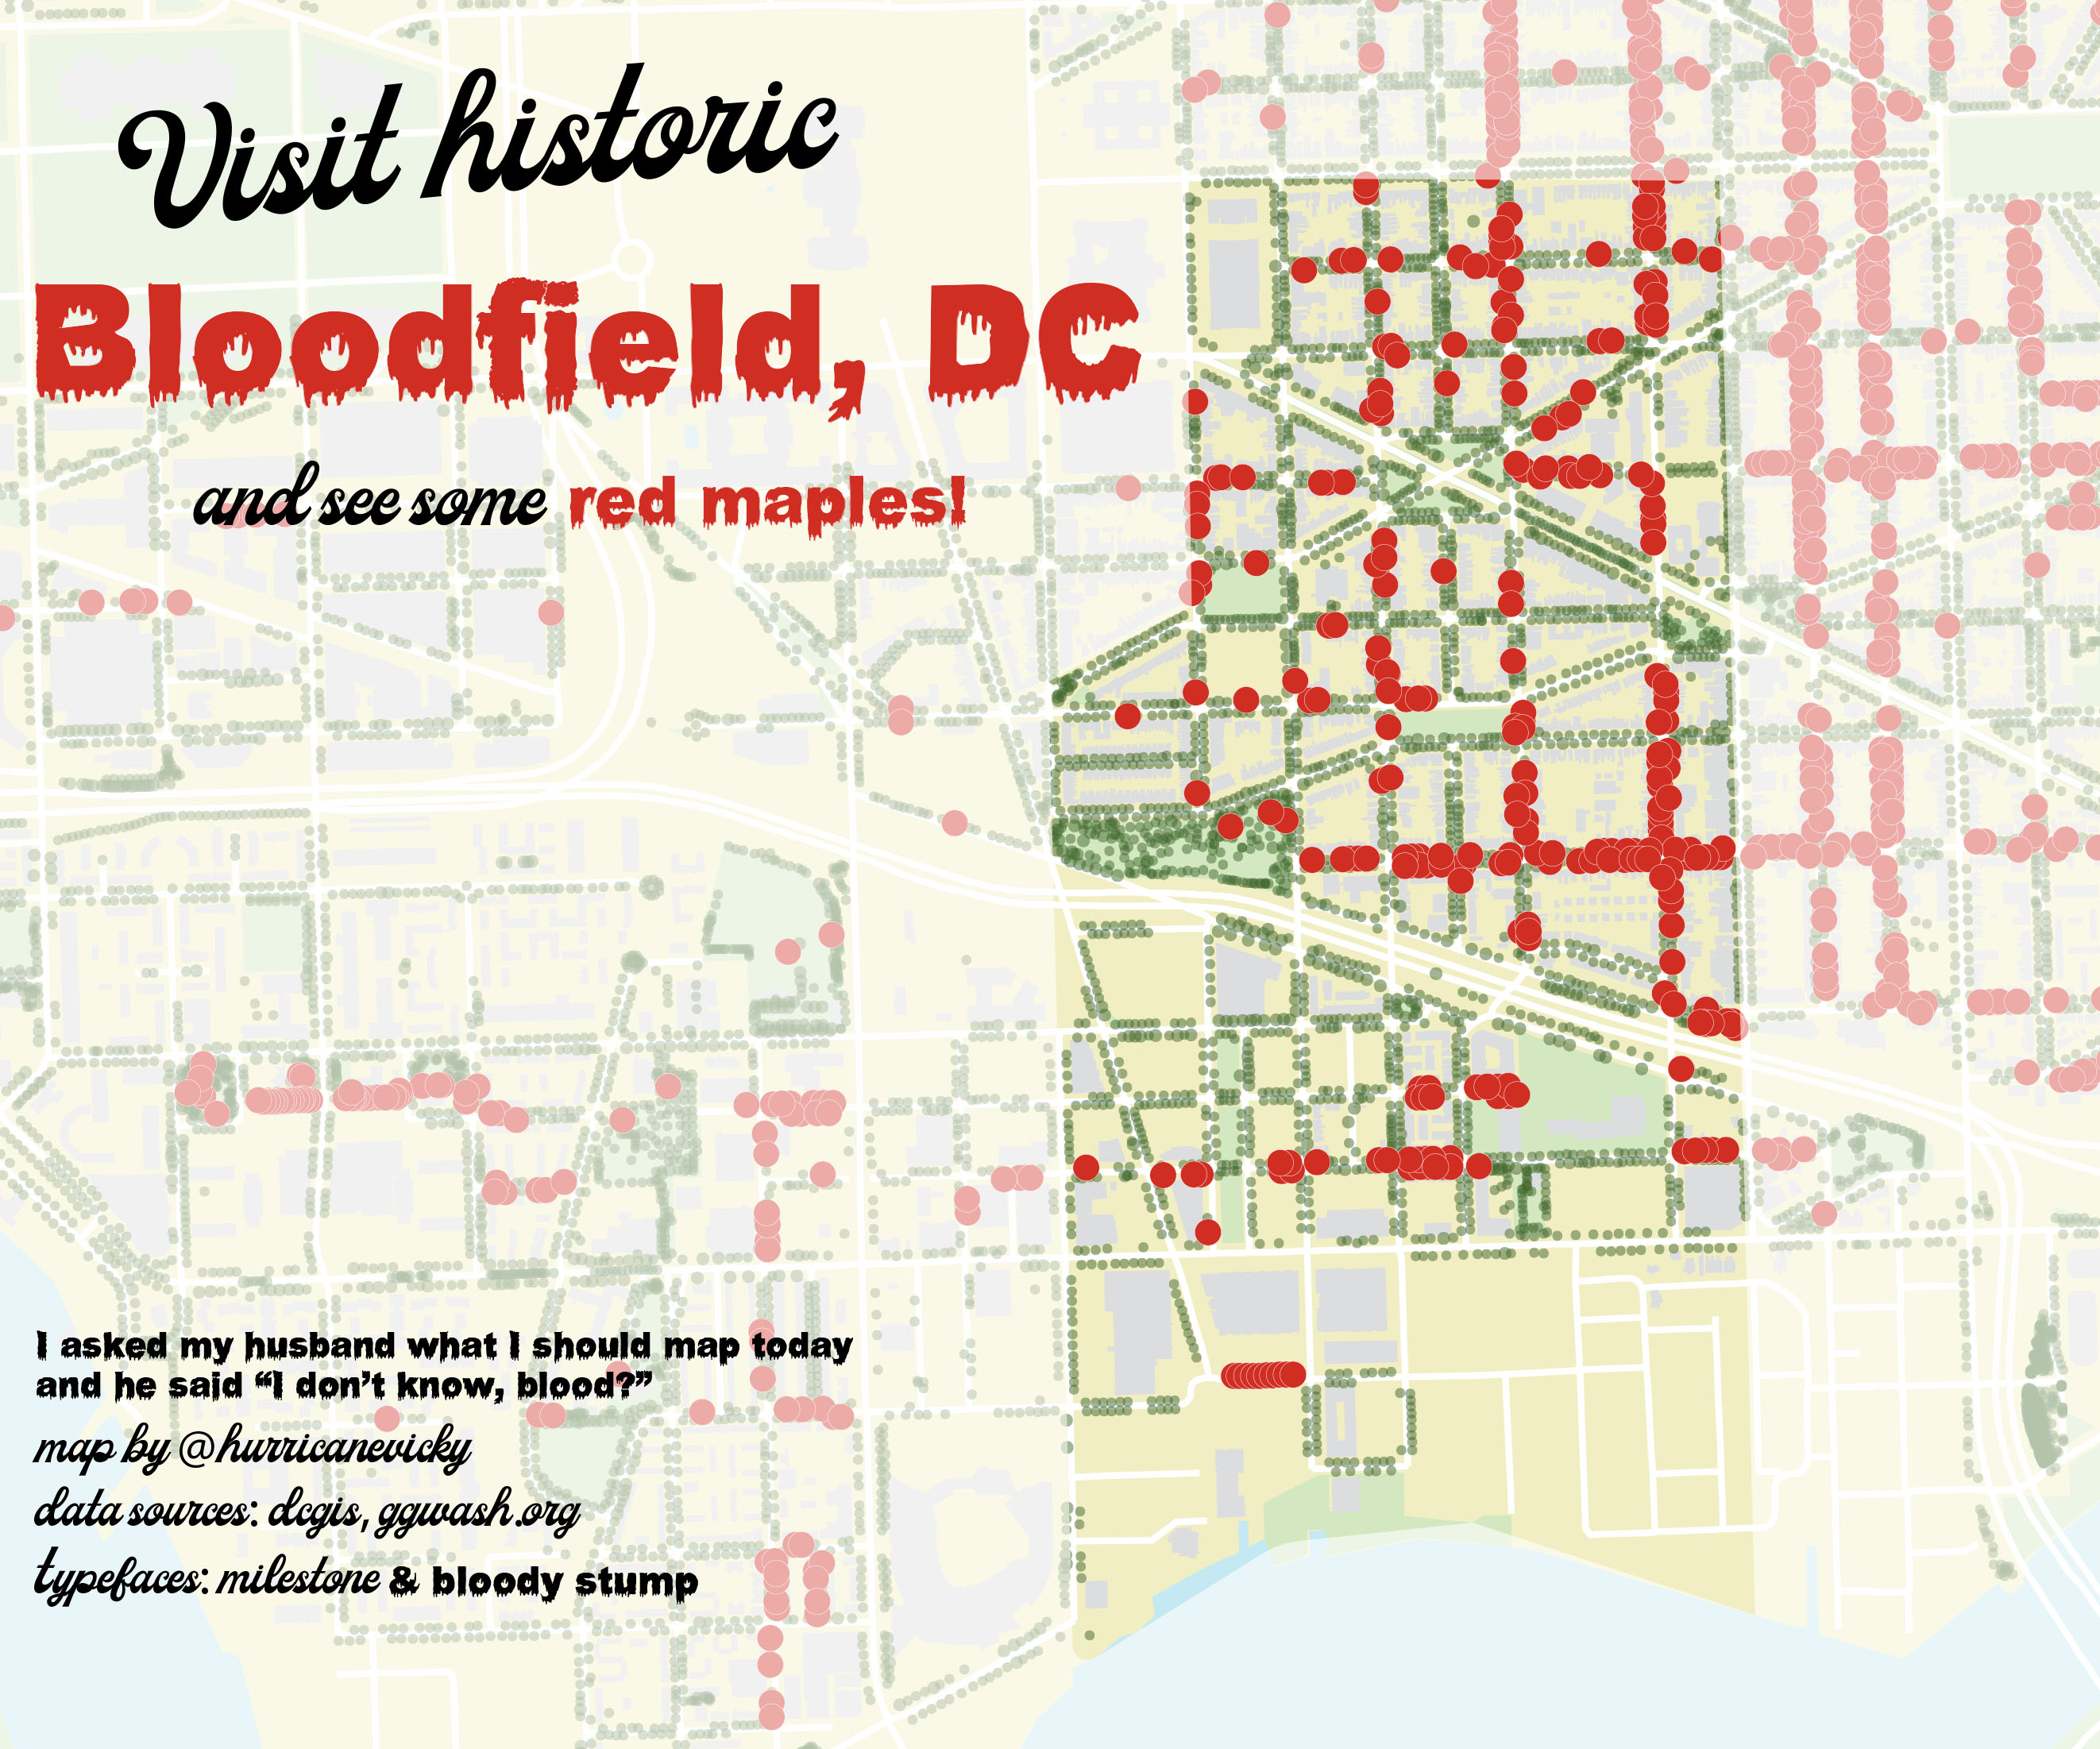 I wasn’t sure what to do for this one, so I asked Taylor for ideas, and he said, “I don’t know, blood?” Which led me to finding this old map of DC neighborhoods and layering that with the current spread of (blood-)red maple trees.
Data from what I am now realizing is called Open Data DC and not DC GIS anymore and Greater Greater Washington. Both typefaces are from dafont’s warehouse of free for personal use fonts.
November 5: Blue
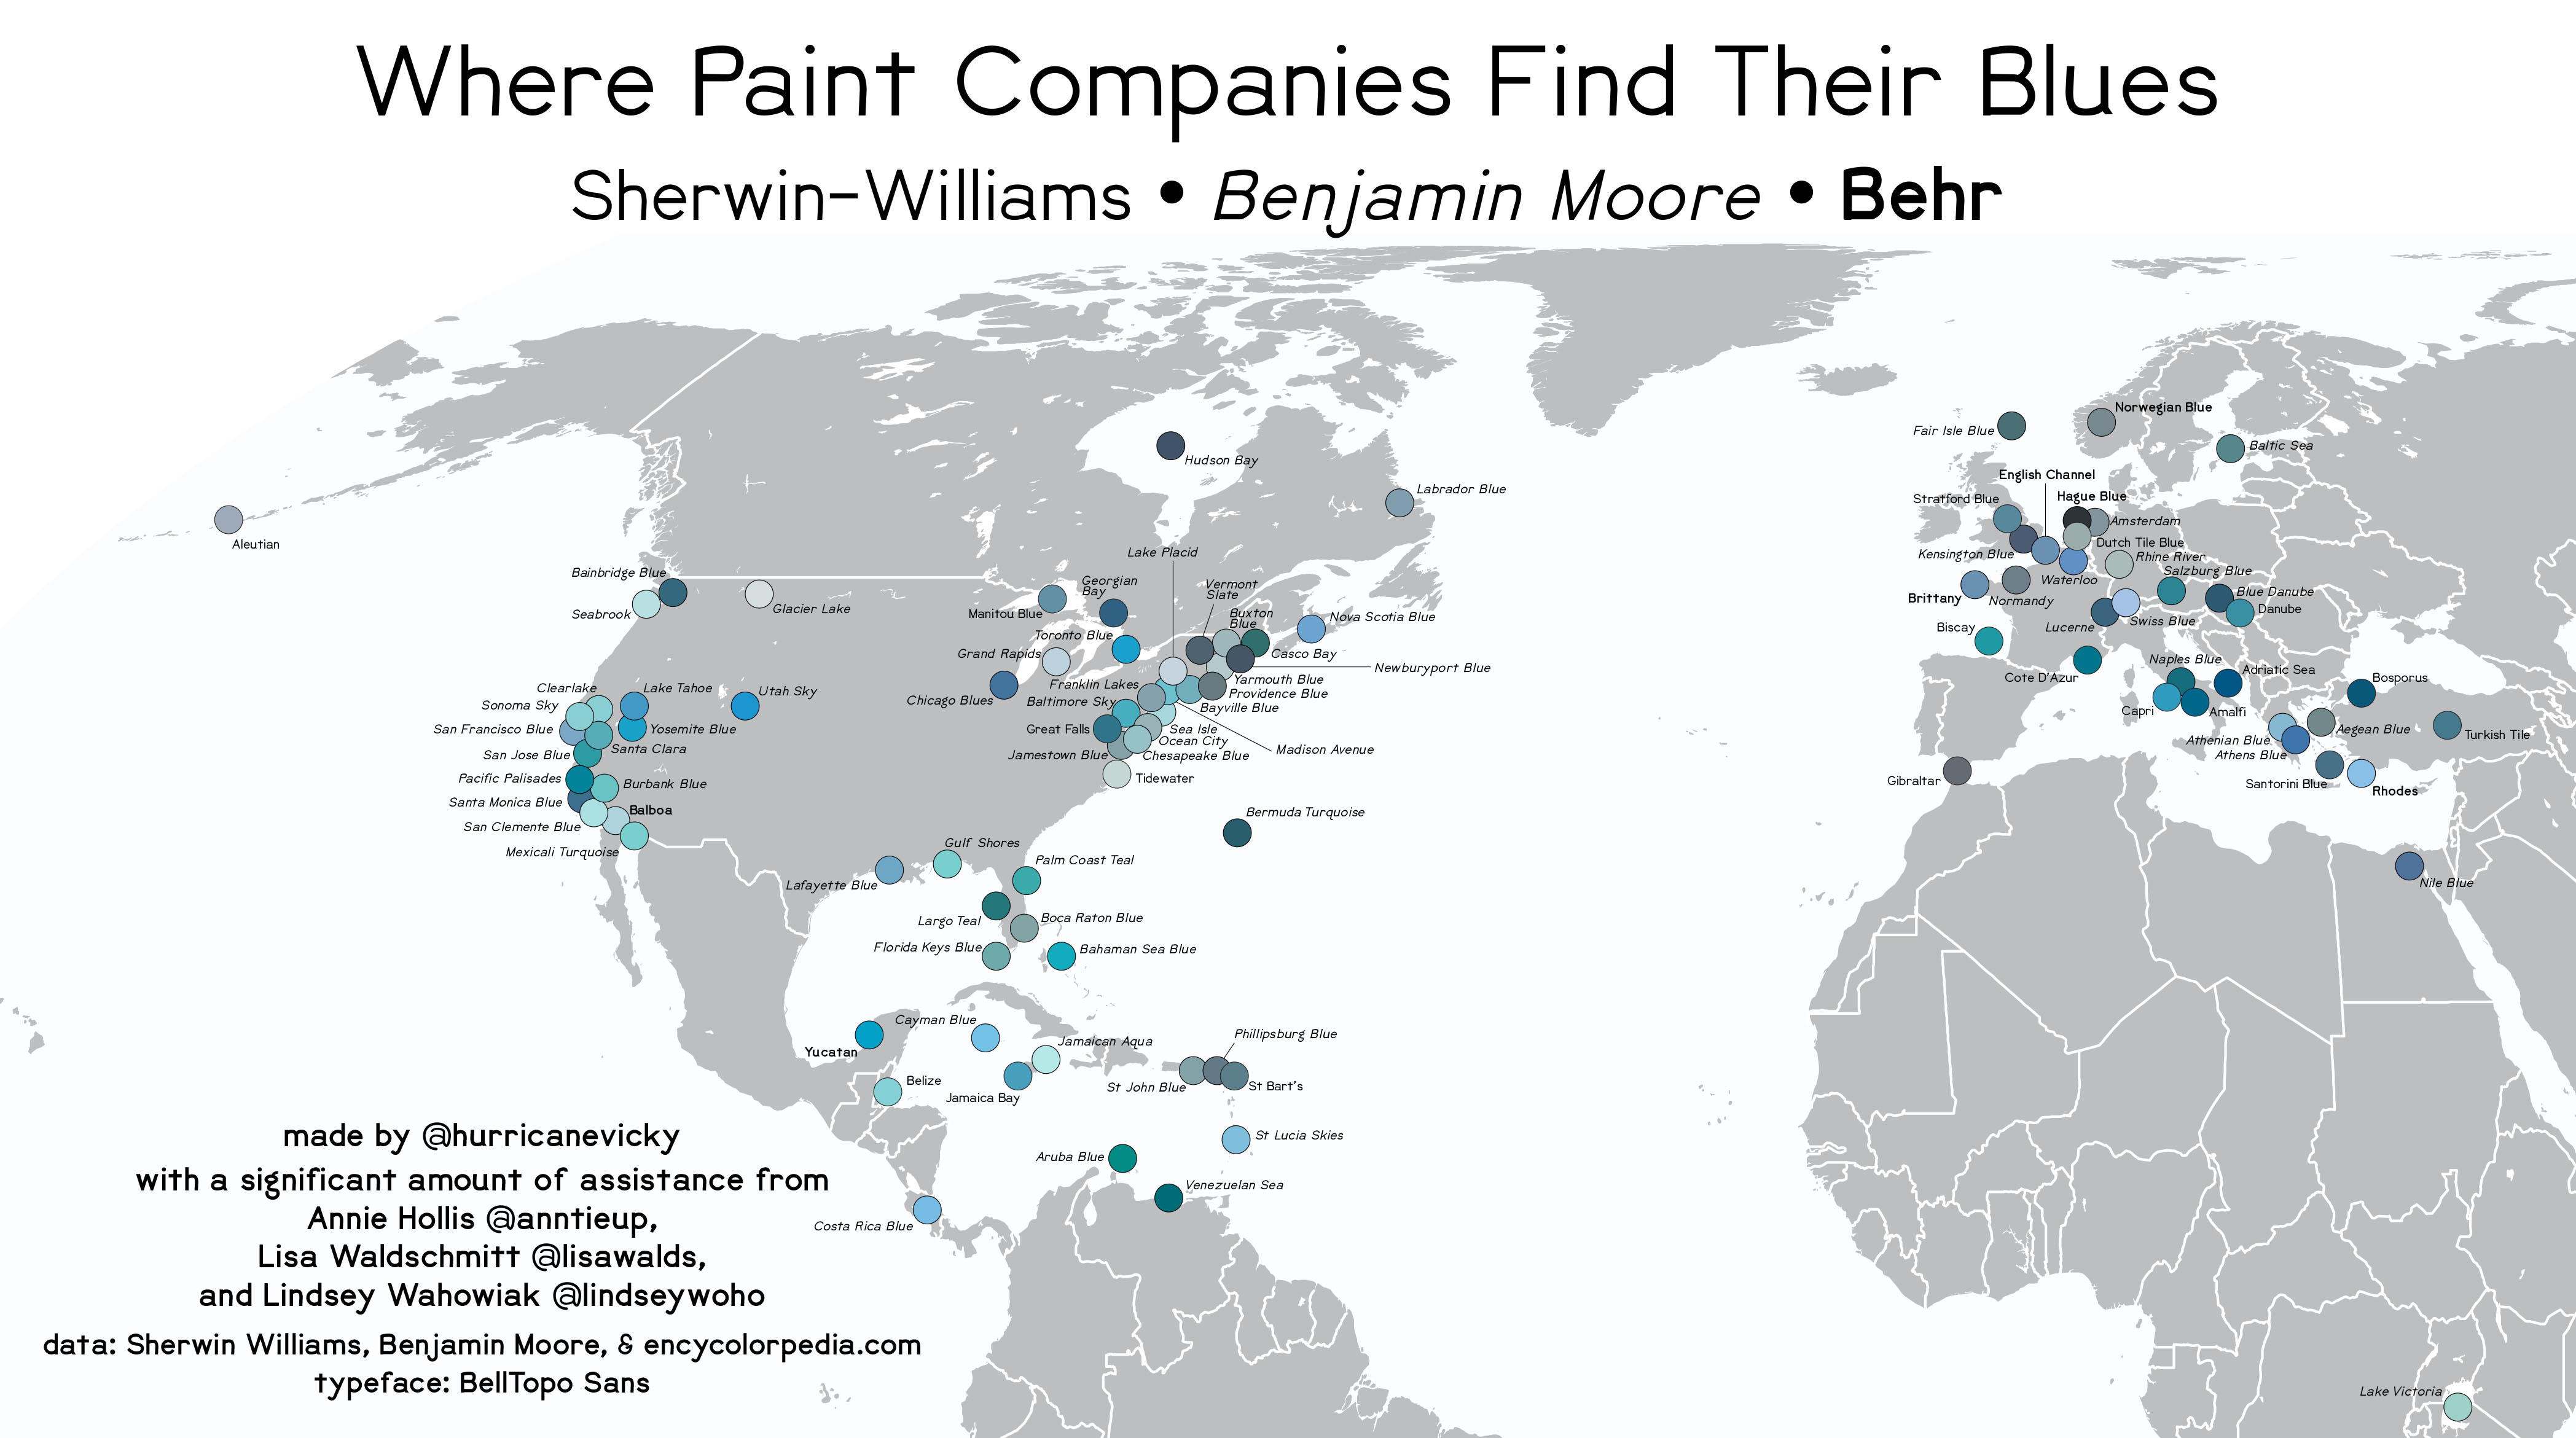 Above is what I posted to twitter, for legibility’s sake. Below is the full map. Someone needs to tell these companies there are colors outside of North America and Europe….
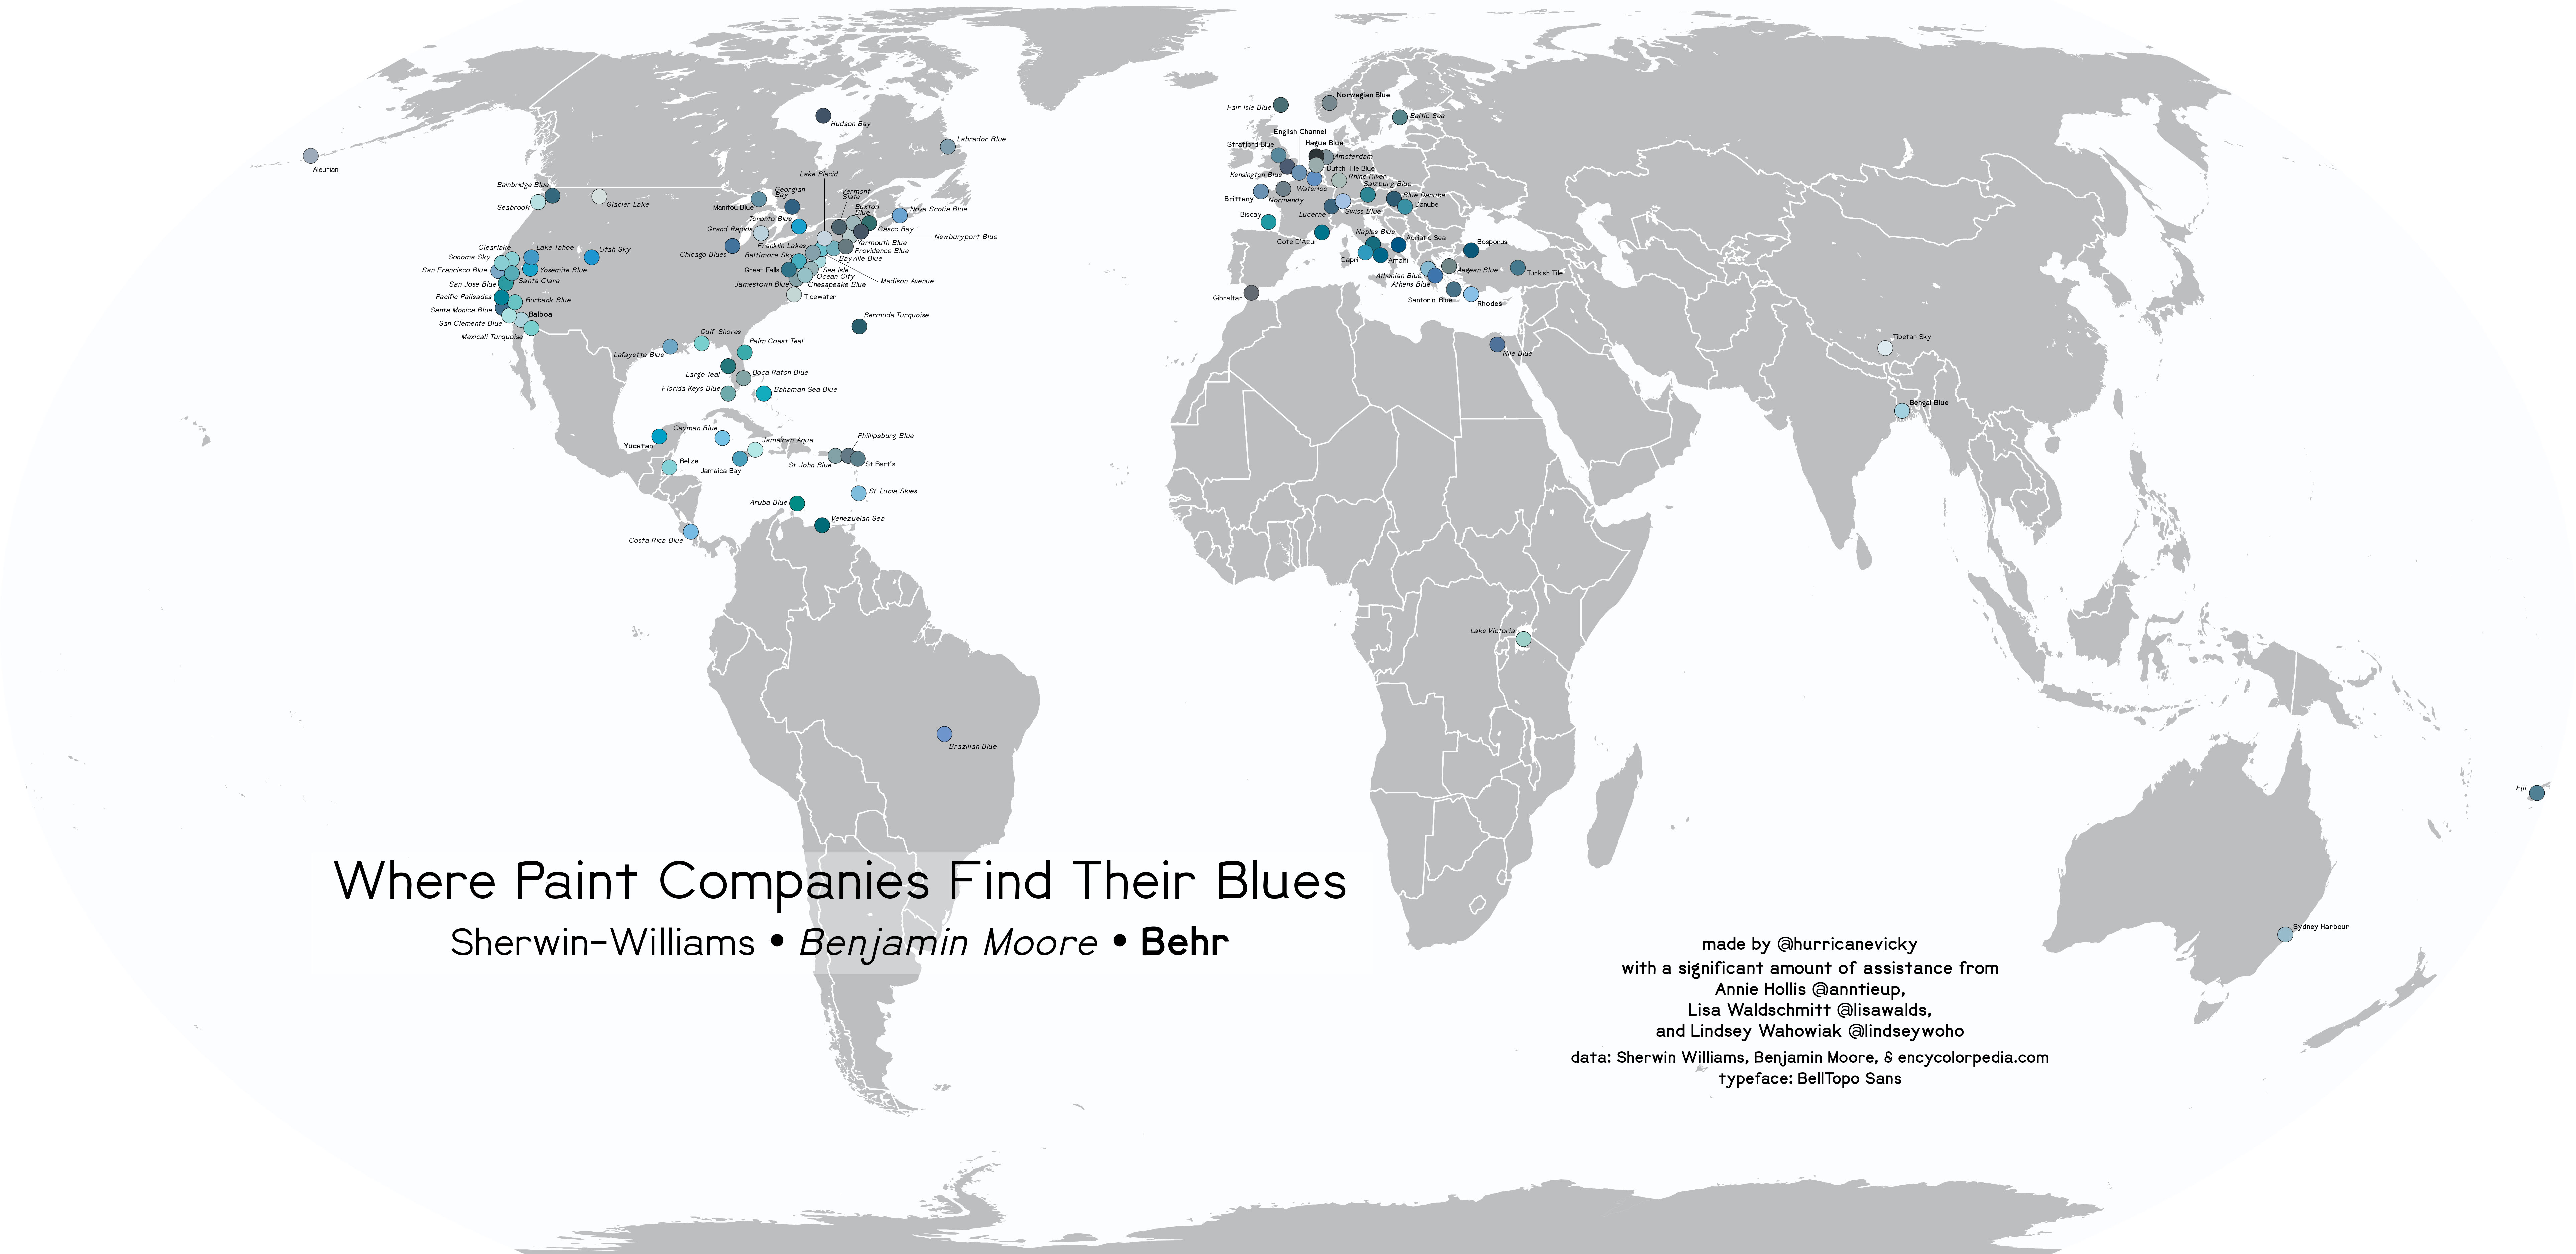
Data from Sherwin-Williams, Benjamin Moore, Encycolorpedia, and Natural Earth. Typeface is, you guessed it, BellTopo Sans.
November 4: Hexagons
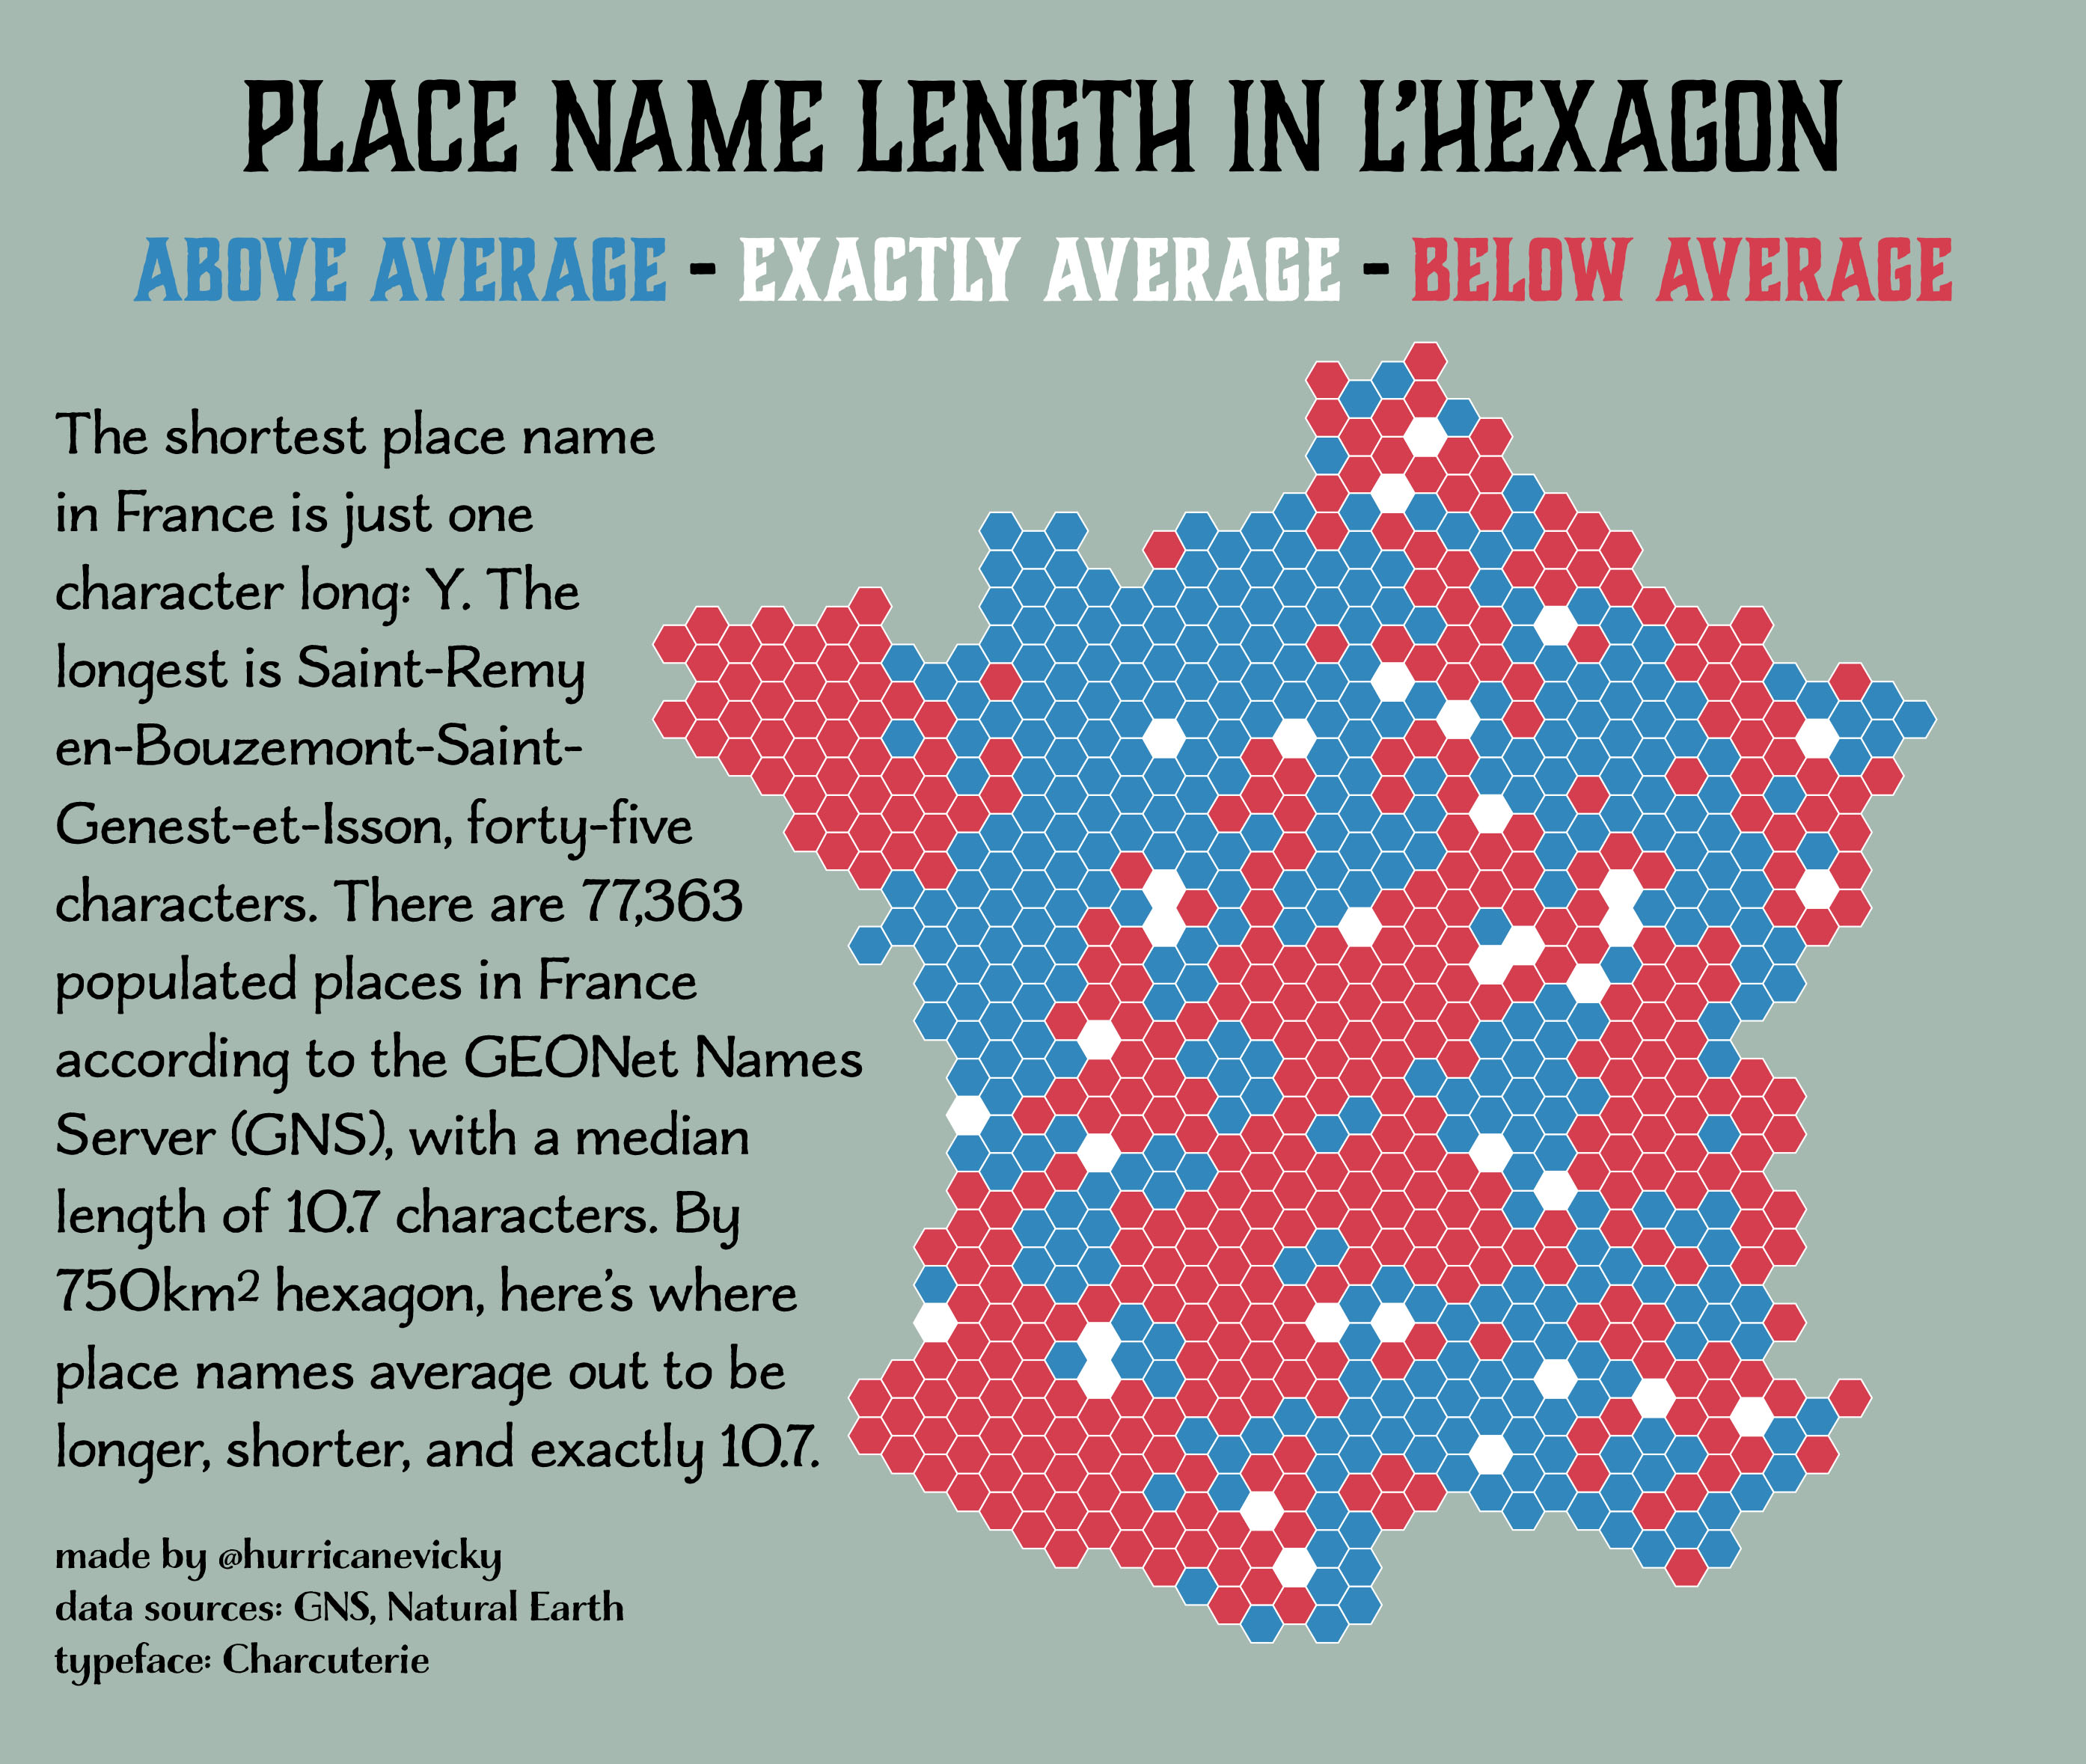 This one started out as something else entirely but I am simply too committed to dumb and pointless mapping.
Data from GNS and Natural Earth, typeface is Charcuterie, which I actually purchased last year for another project and am determined to get my money’s worth so I’m sure it’ll end up on a lot more of these as the month progresses.
November 3: Polygons
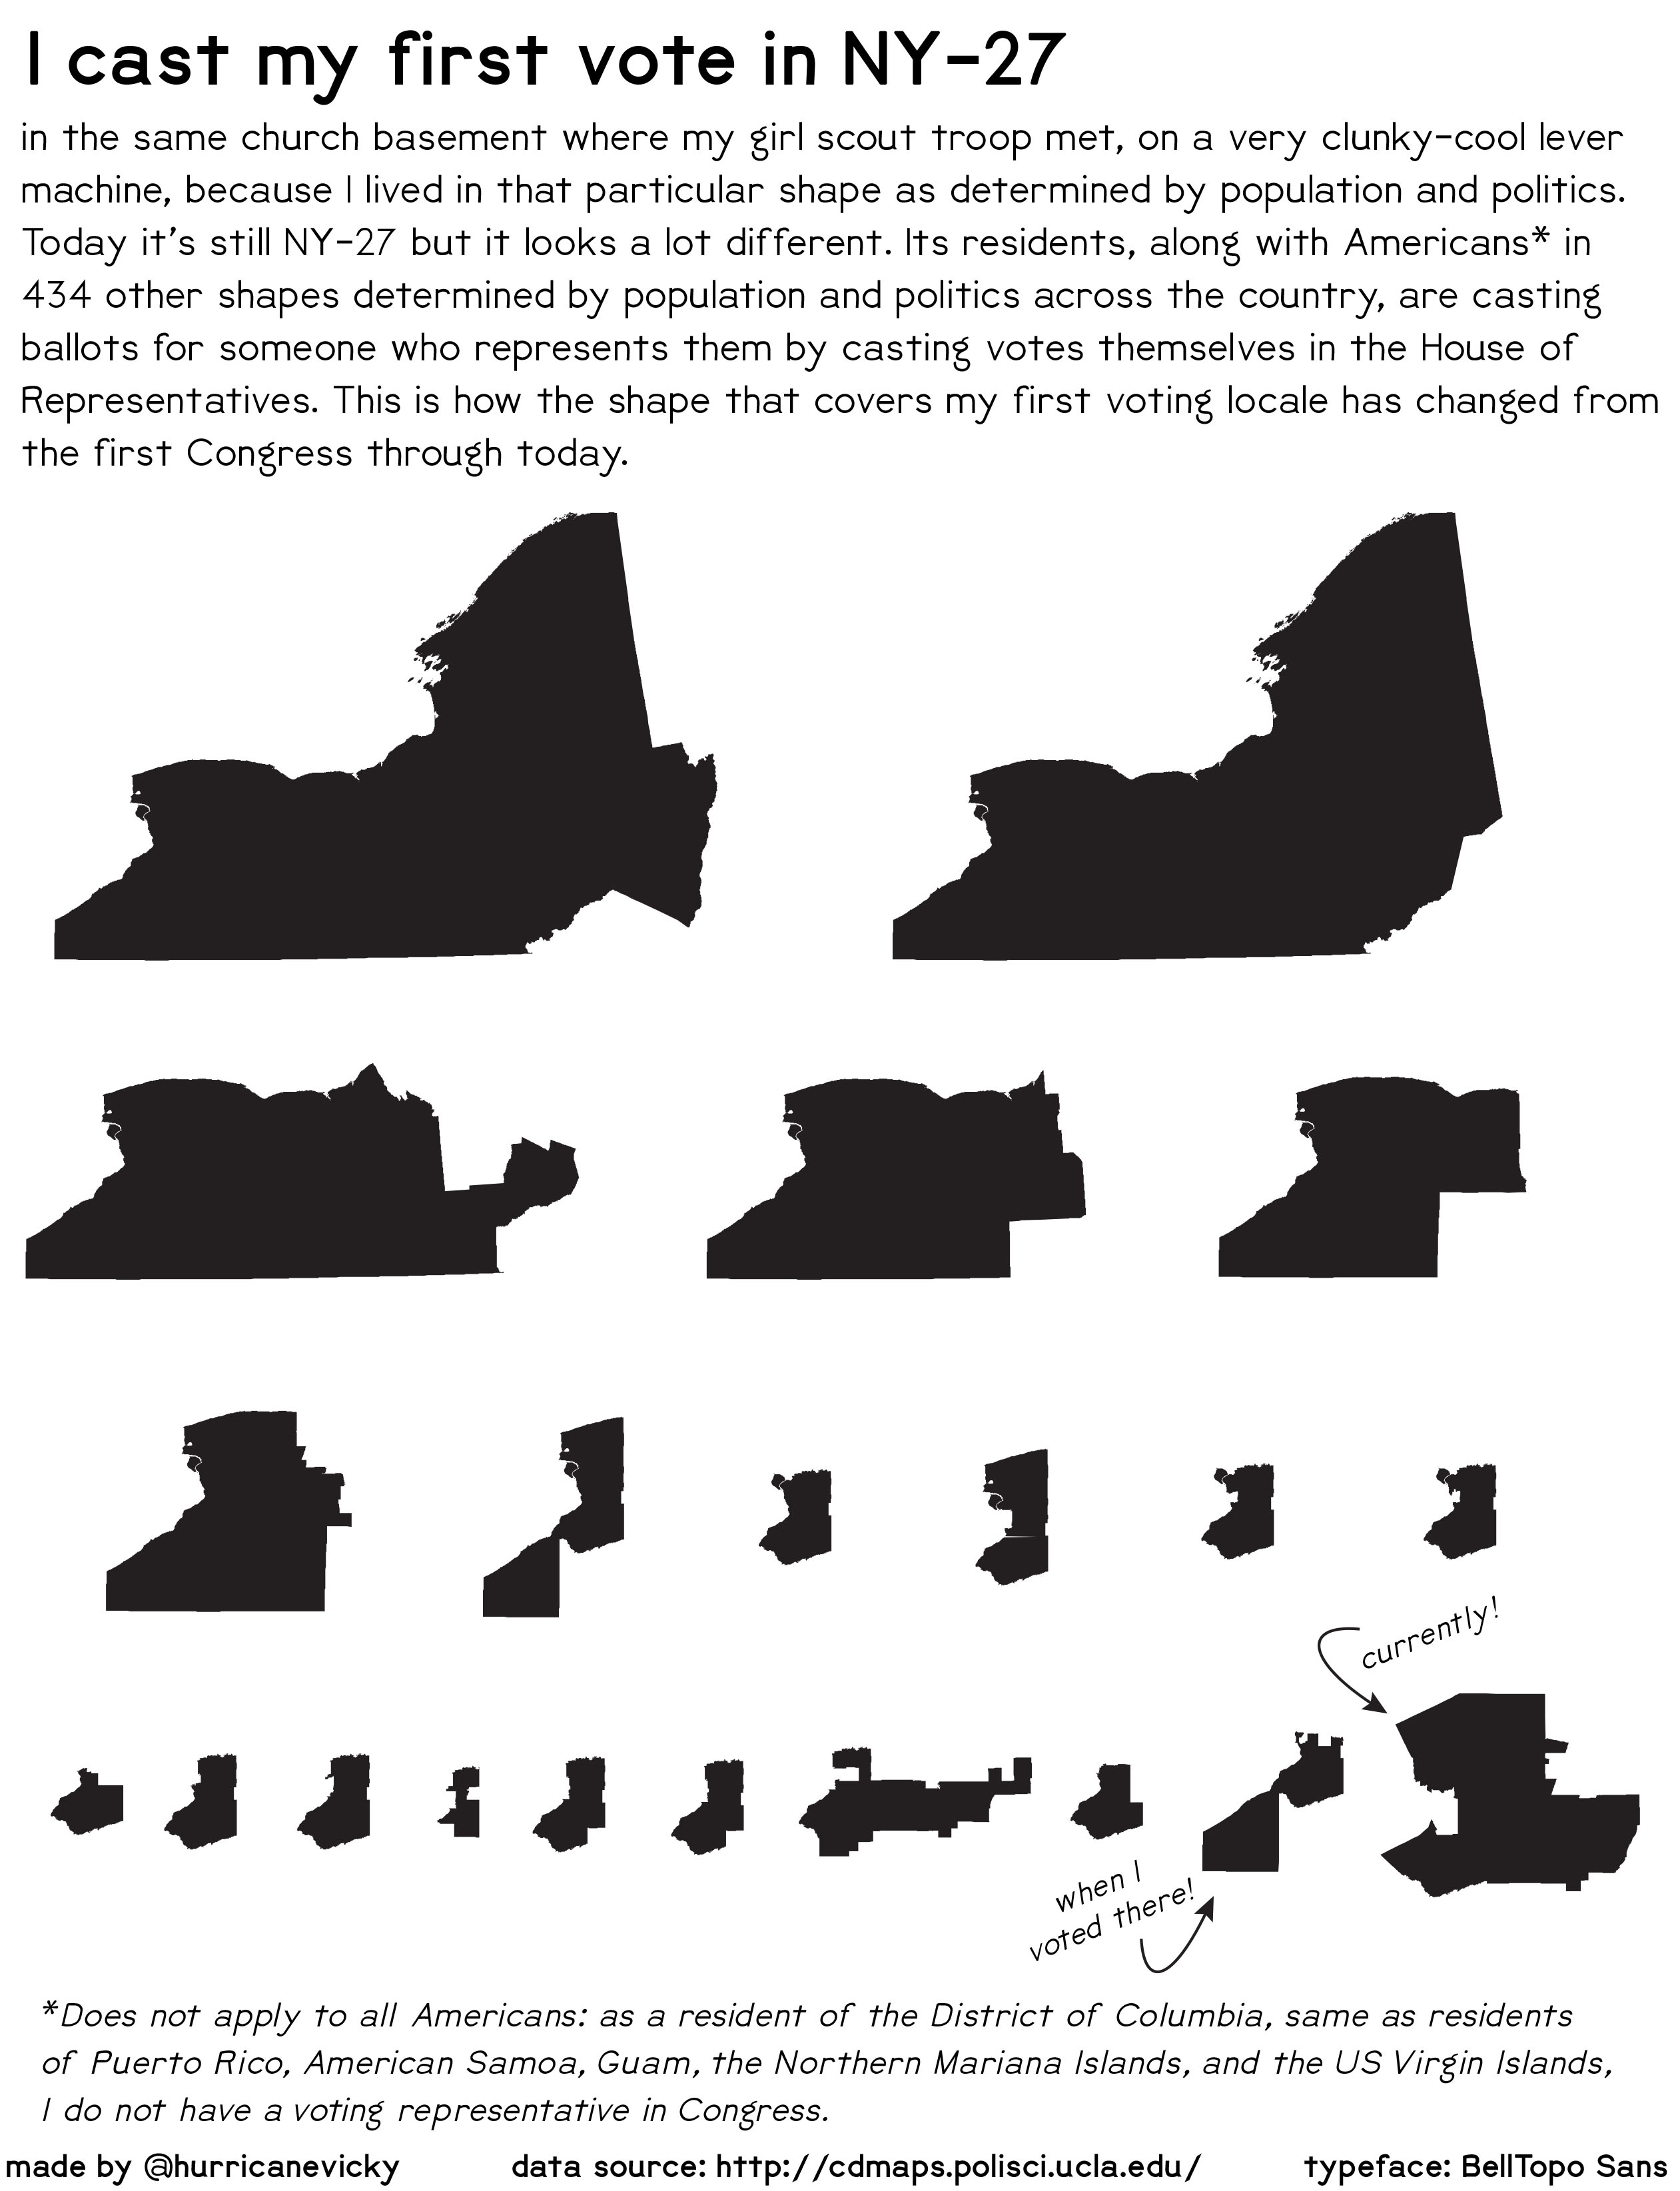
Since it’s election day, I figured it was only right to do a set of congressional district polygons.
Data from http://cdmaps.polisci.ucla.edu/, typeface is again BellTopo Sans.
November 2: Lines
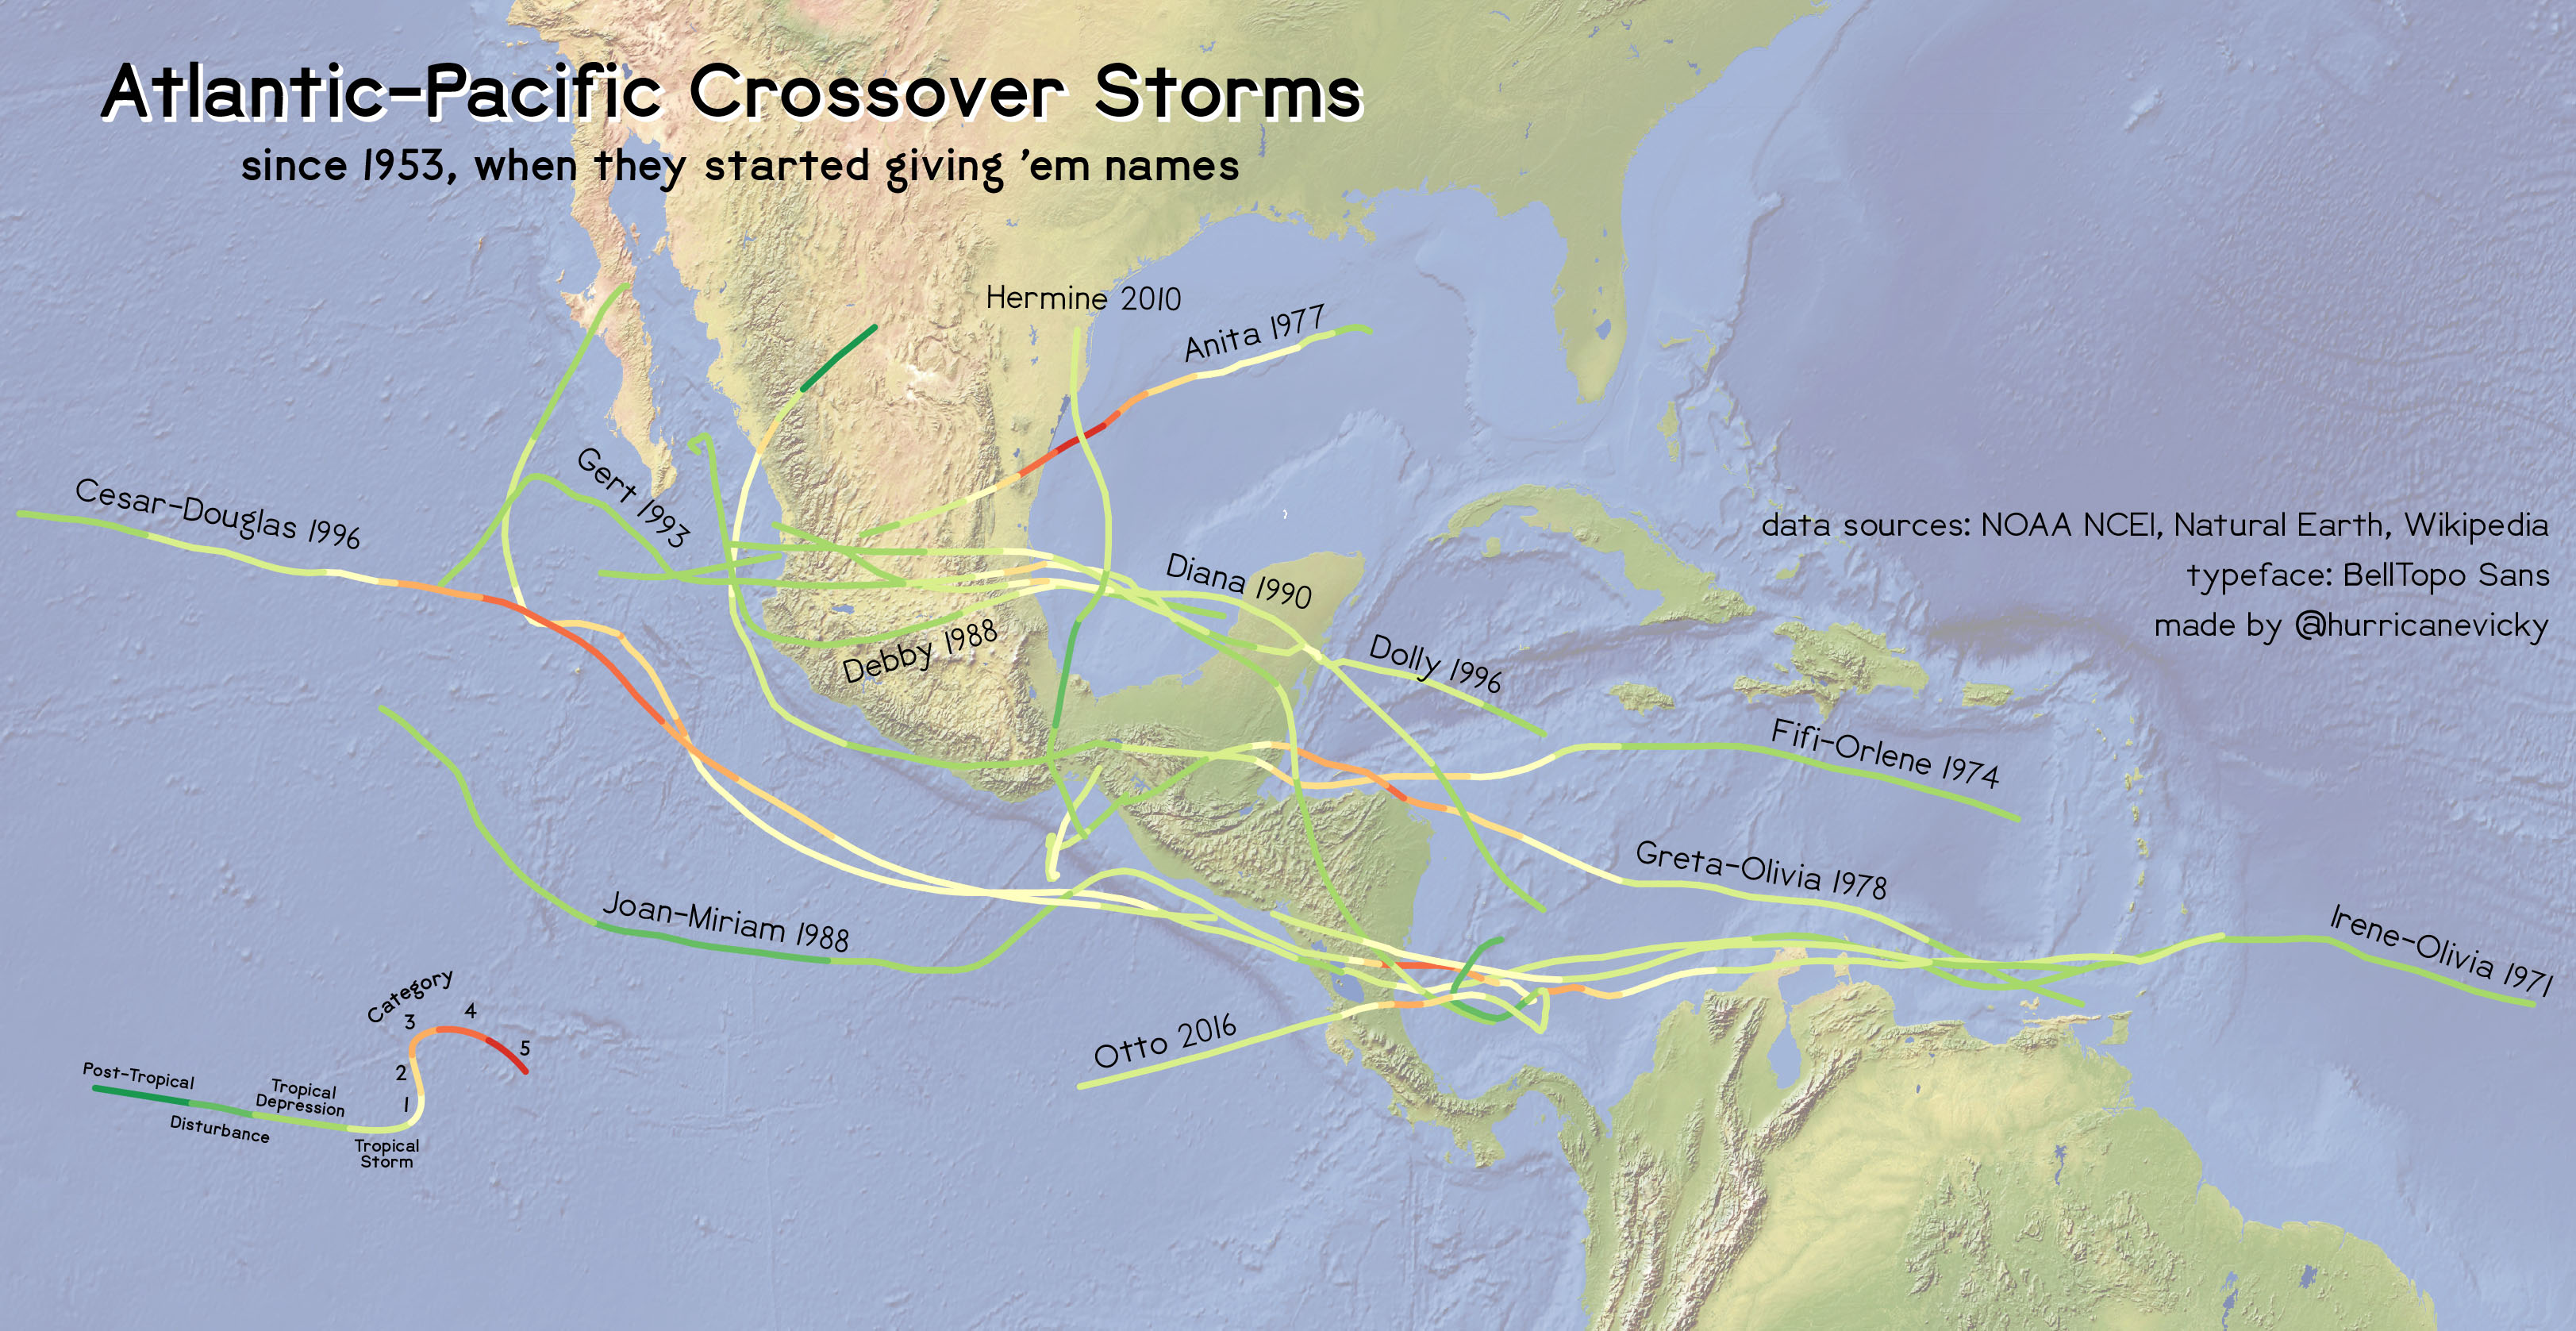 Rarely - only twelve times since 1953 - a storm will cross over from the Atlantic to the Pacific basin (or vice versa).
Data from NOAA’s National Centers for Environmental Information, Natural Earth, and Wikipedia. Typeface is of course BellTopo Sans.
November 1: Points
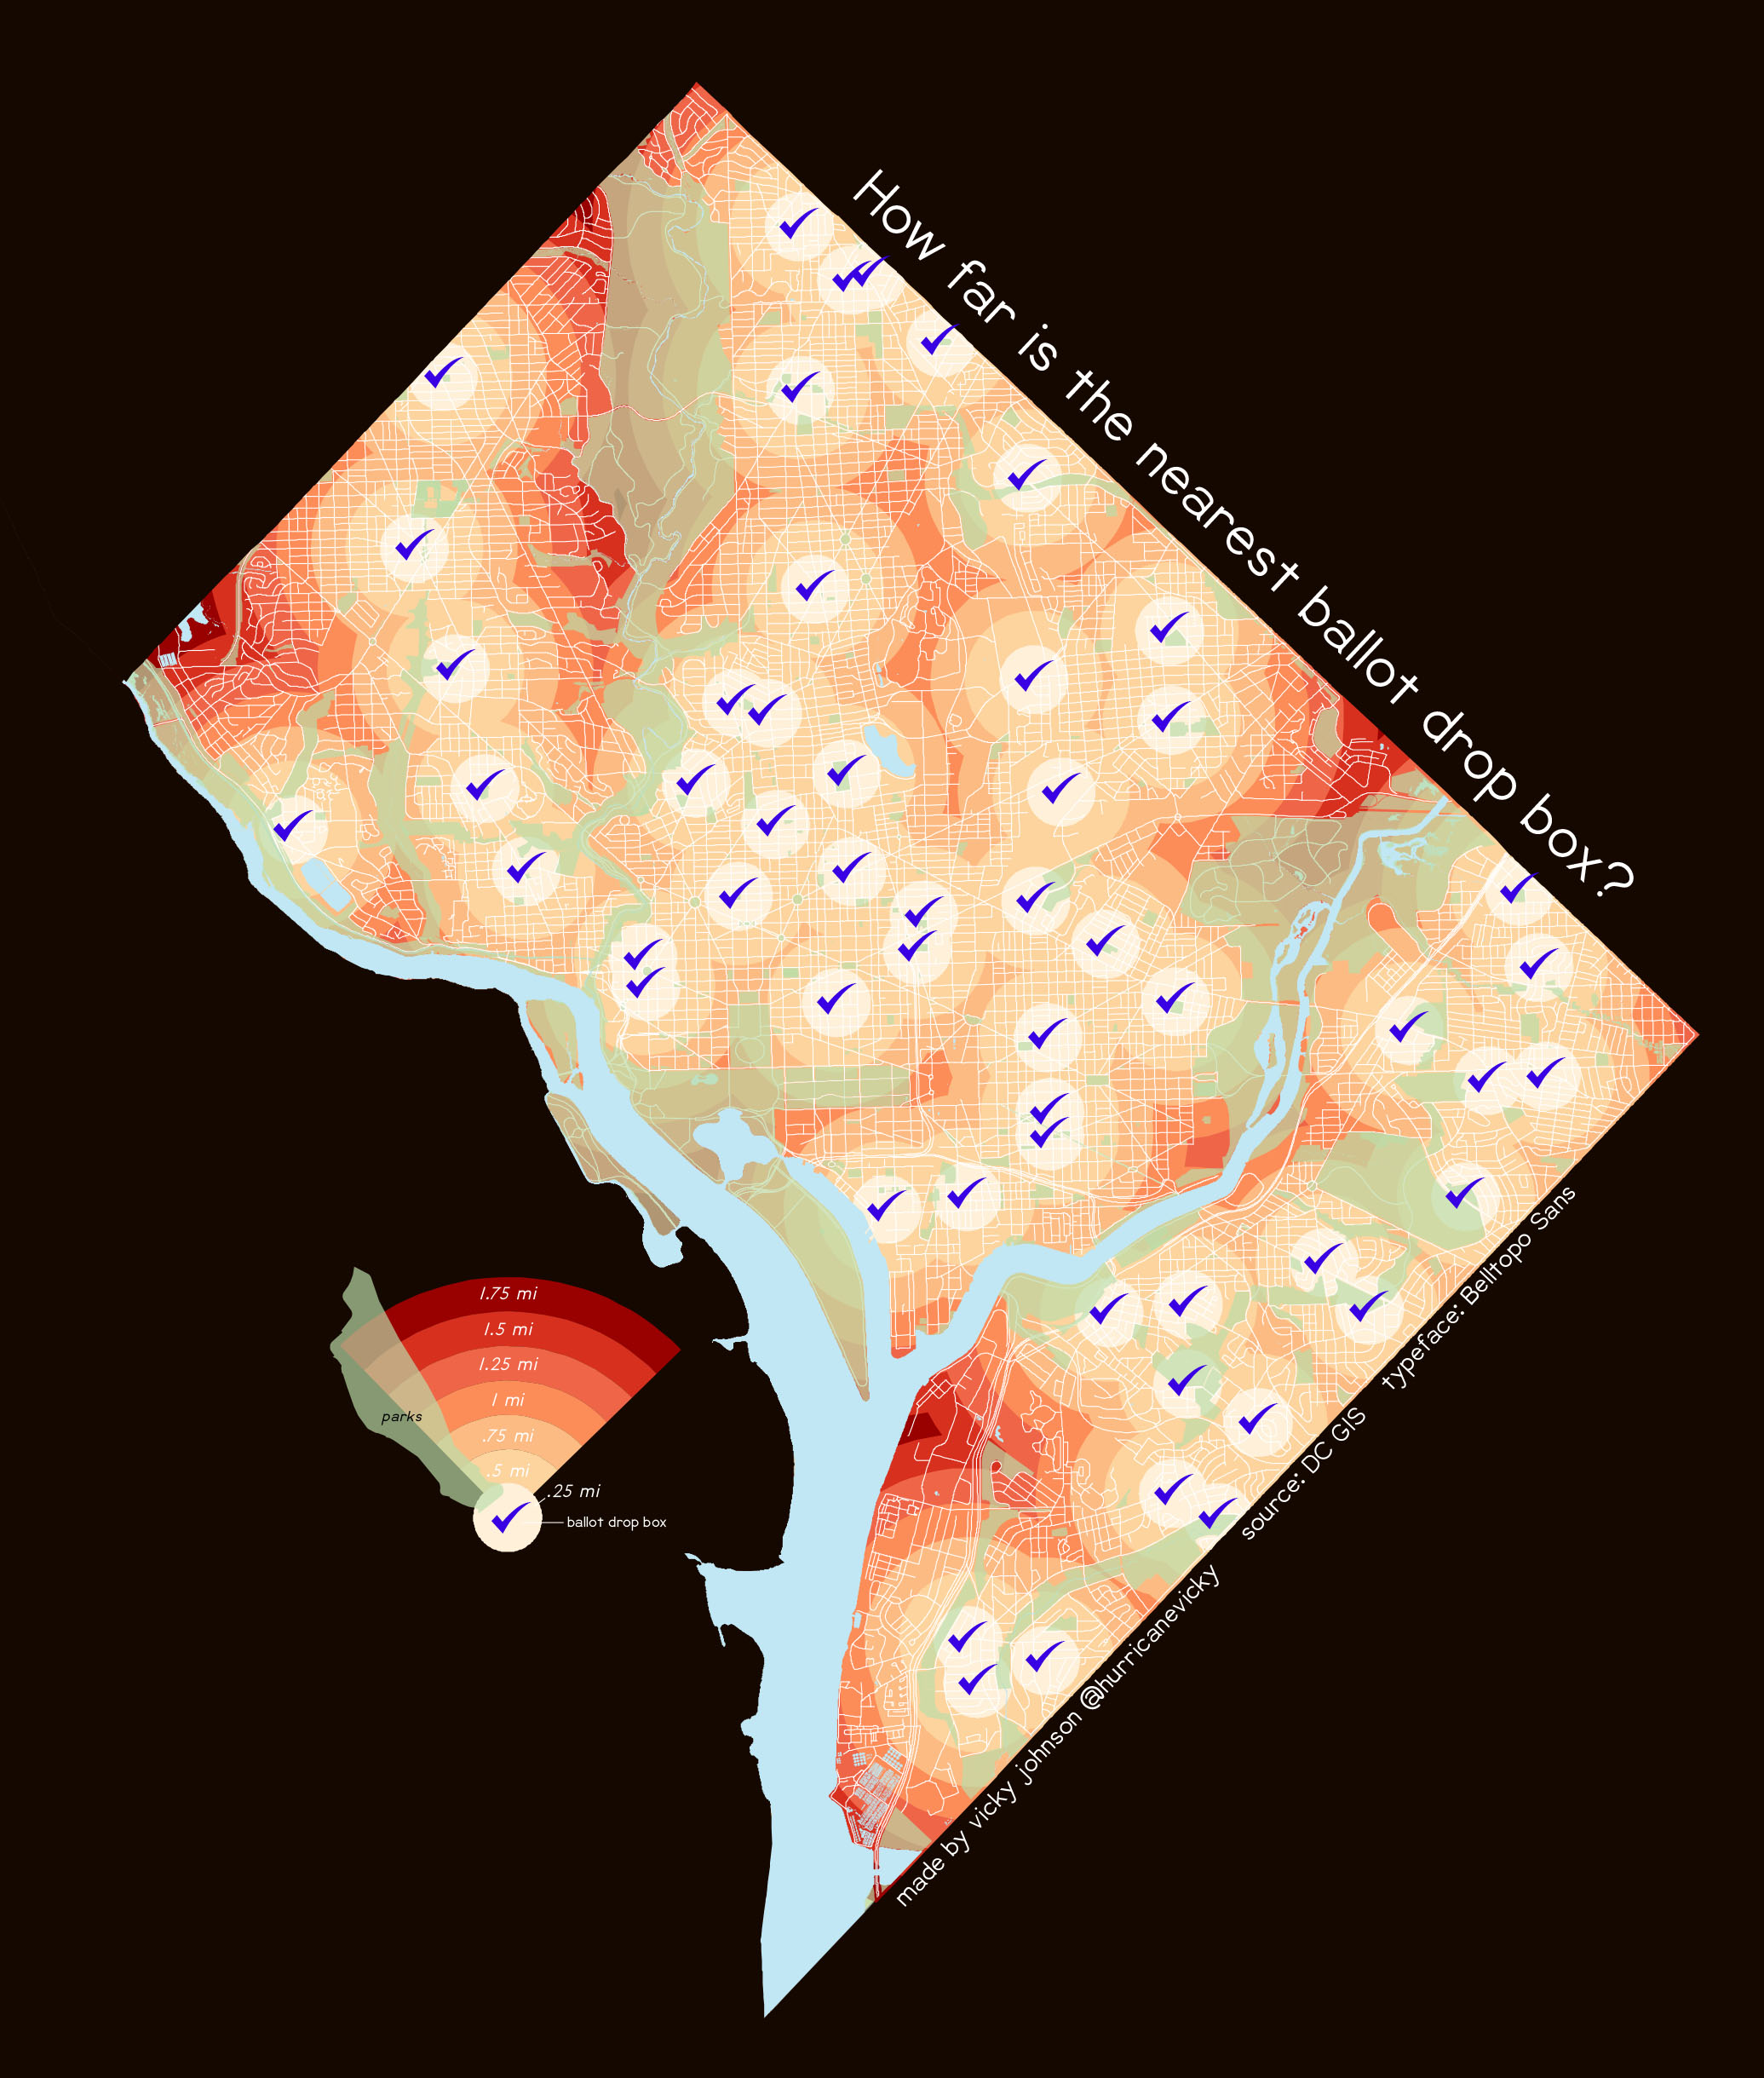 Actually made this one on October 1st…too excited for the challenge I guess. Ah well.
Data from DC GIS. Typeface is BellTopo Sans.
Page template forked from evanca