Best of the 2020 and 2021 30 Day Map Challenge
vicky johnson-dahl
cartographer, dc
twitter // email
(more about the map challenge)
November 25, 2020: COVID-19
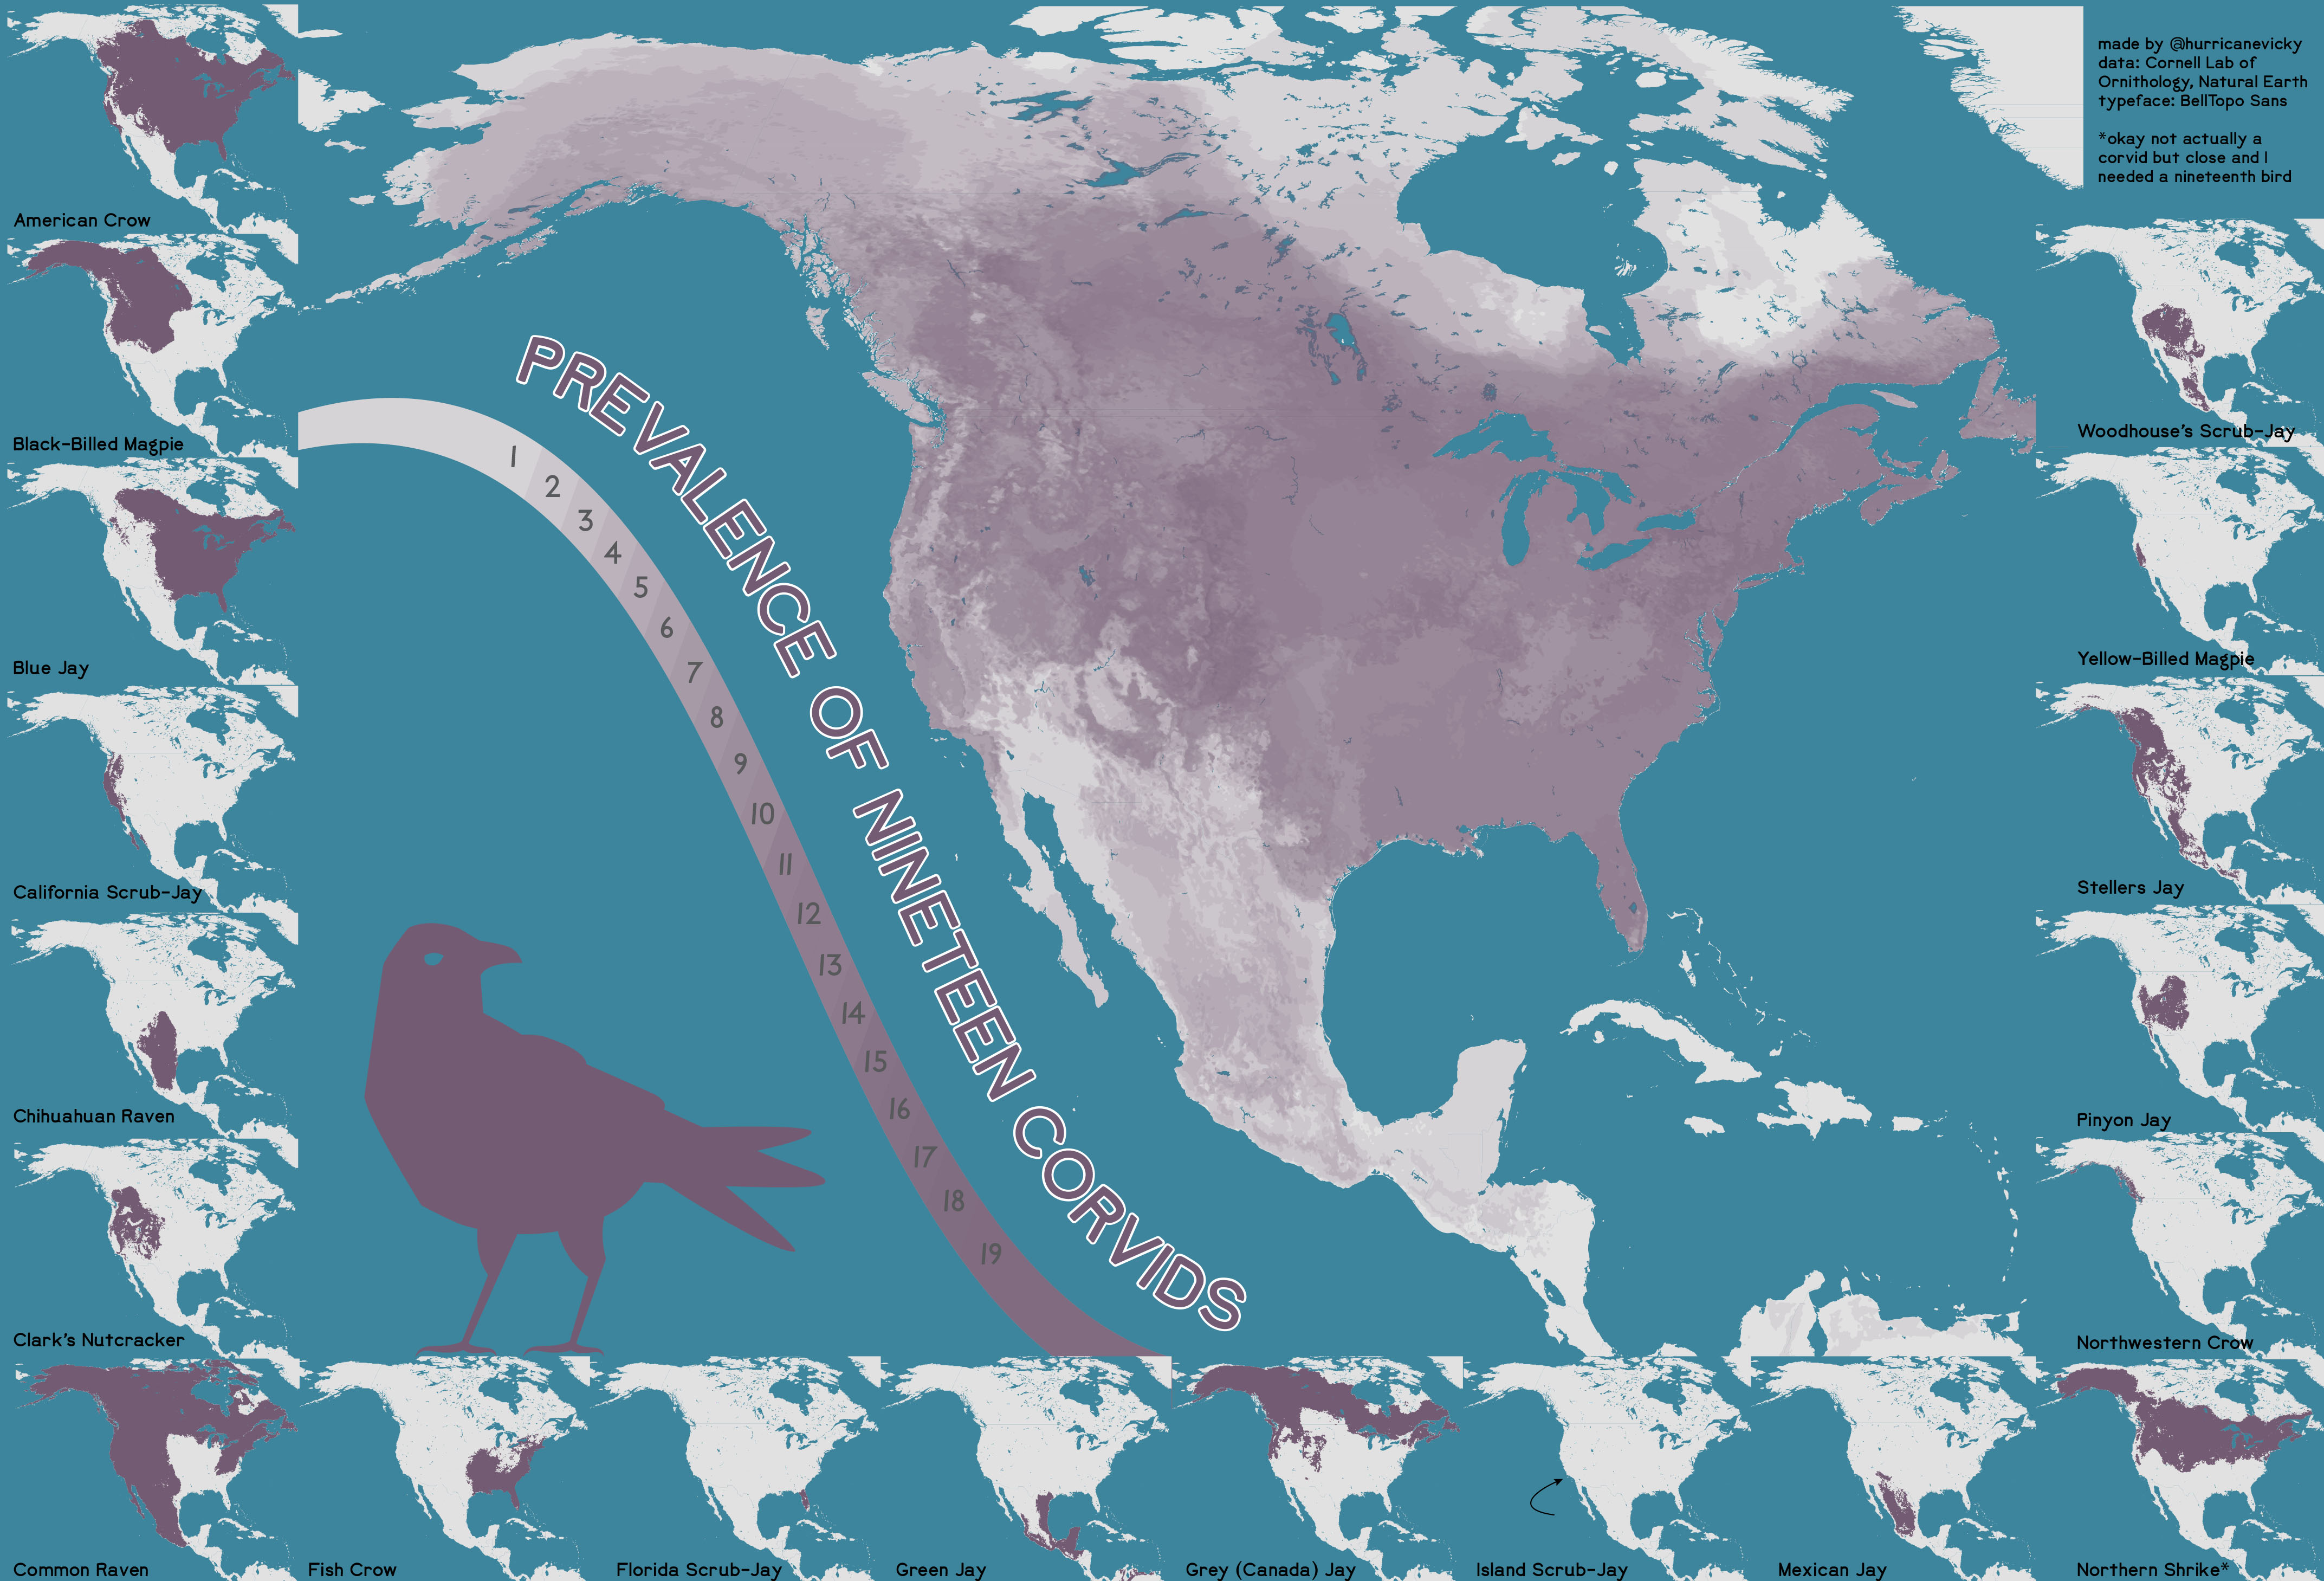 Theme is Corvid 19? Did I read that right?
I’ve done a bunch of COVID-19 mapping at work. I have not done nearly as much dumb joke mapping.
Data from Cornell Lab of Ornithology, which only had 18 corvids so I threw in a shrike as well (close enough) and Natural Earth. Typeface is BellTopo Sans.
November 2, 2021: Lines
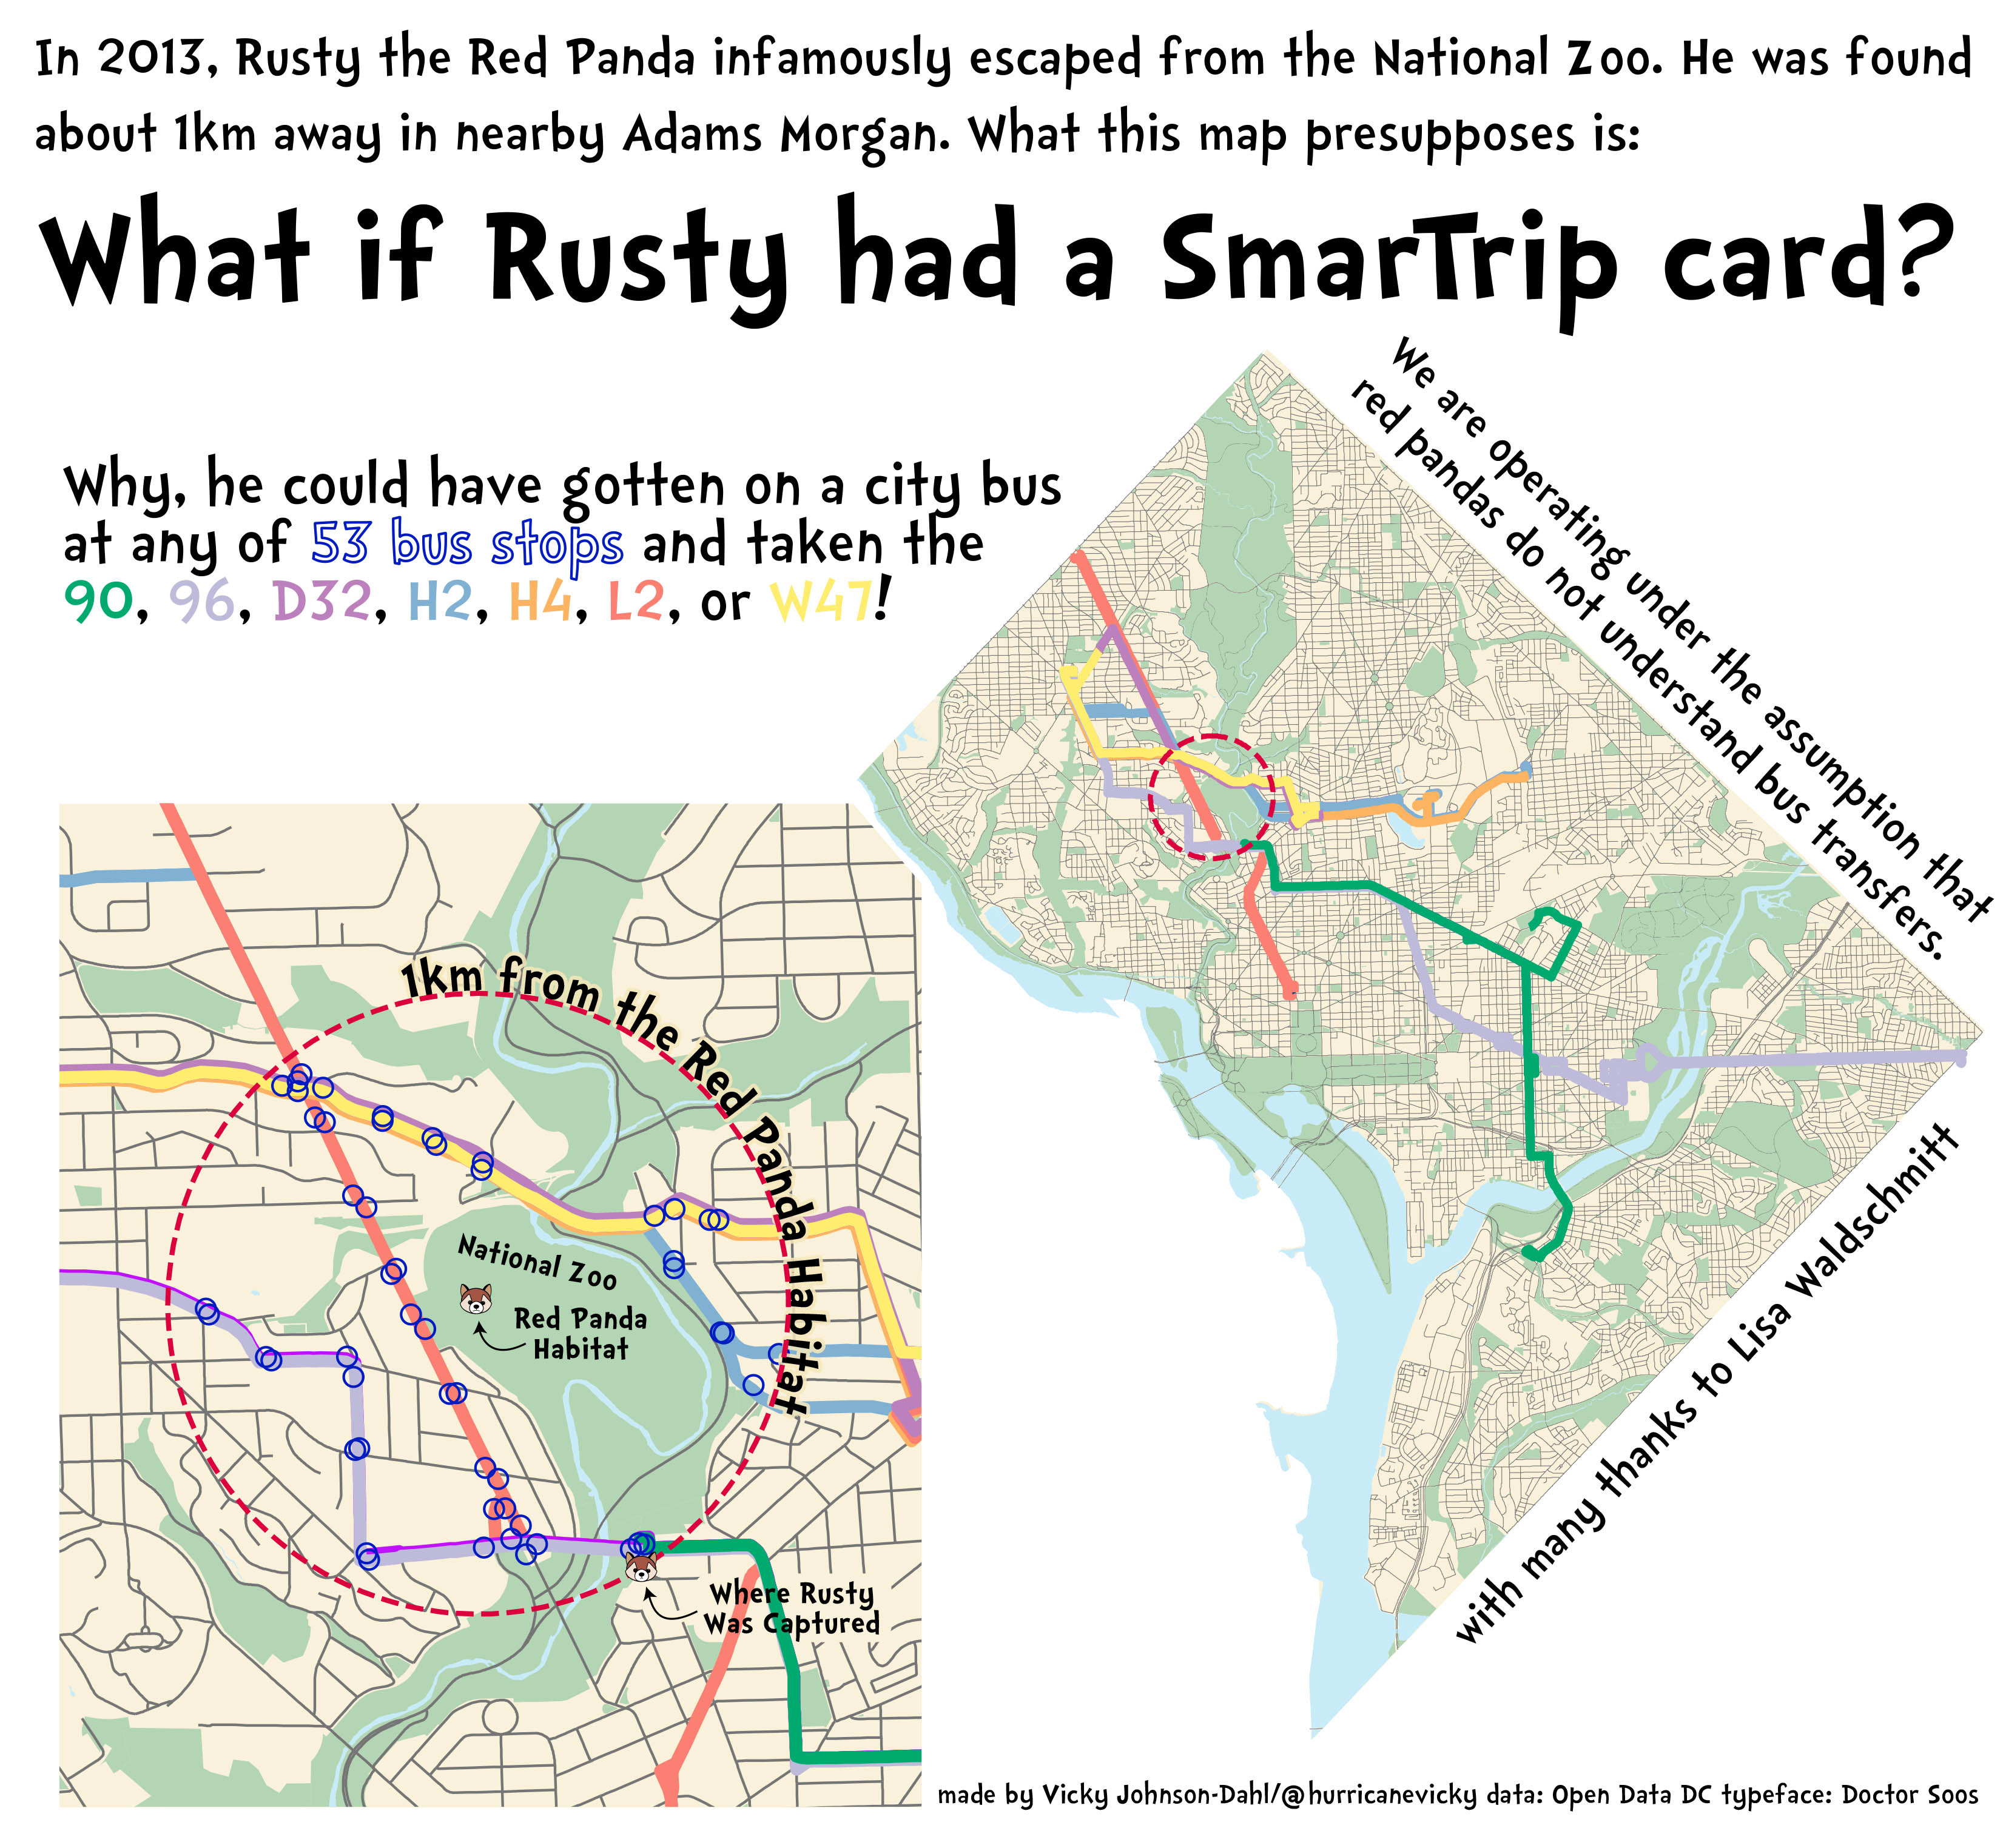 Well I guess he could have gotten on the metro too but that strains plausibility, don’t you think?
Data from DC Open Data. Typeface is Doctor Soos.
November 24, 2021: Historical
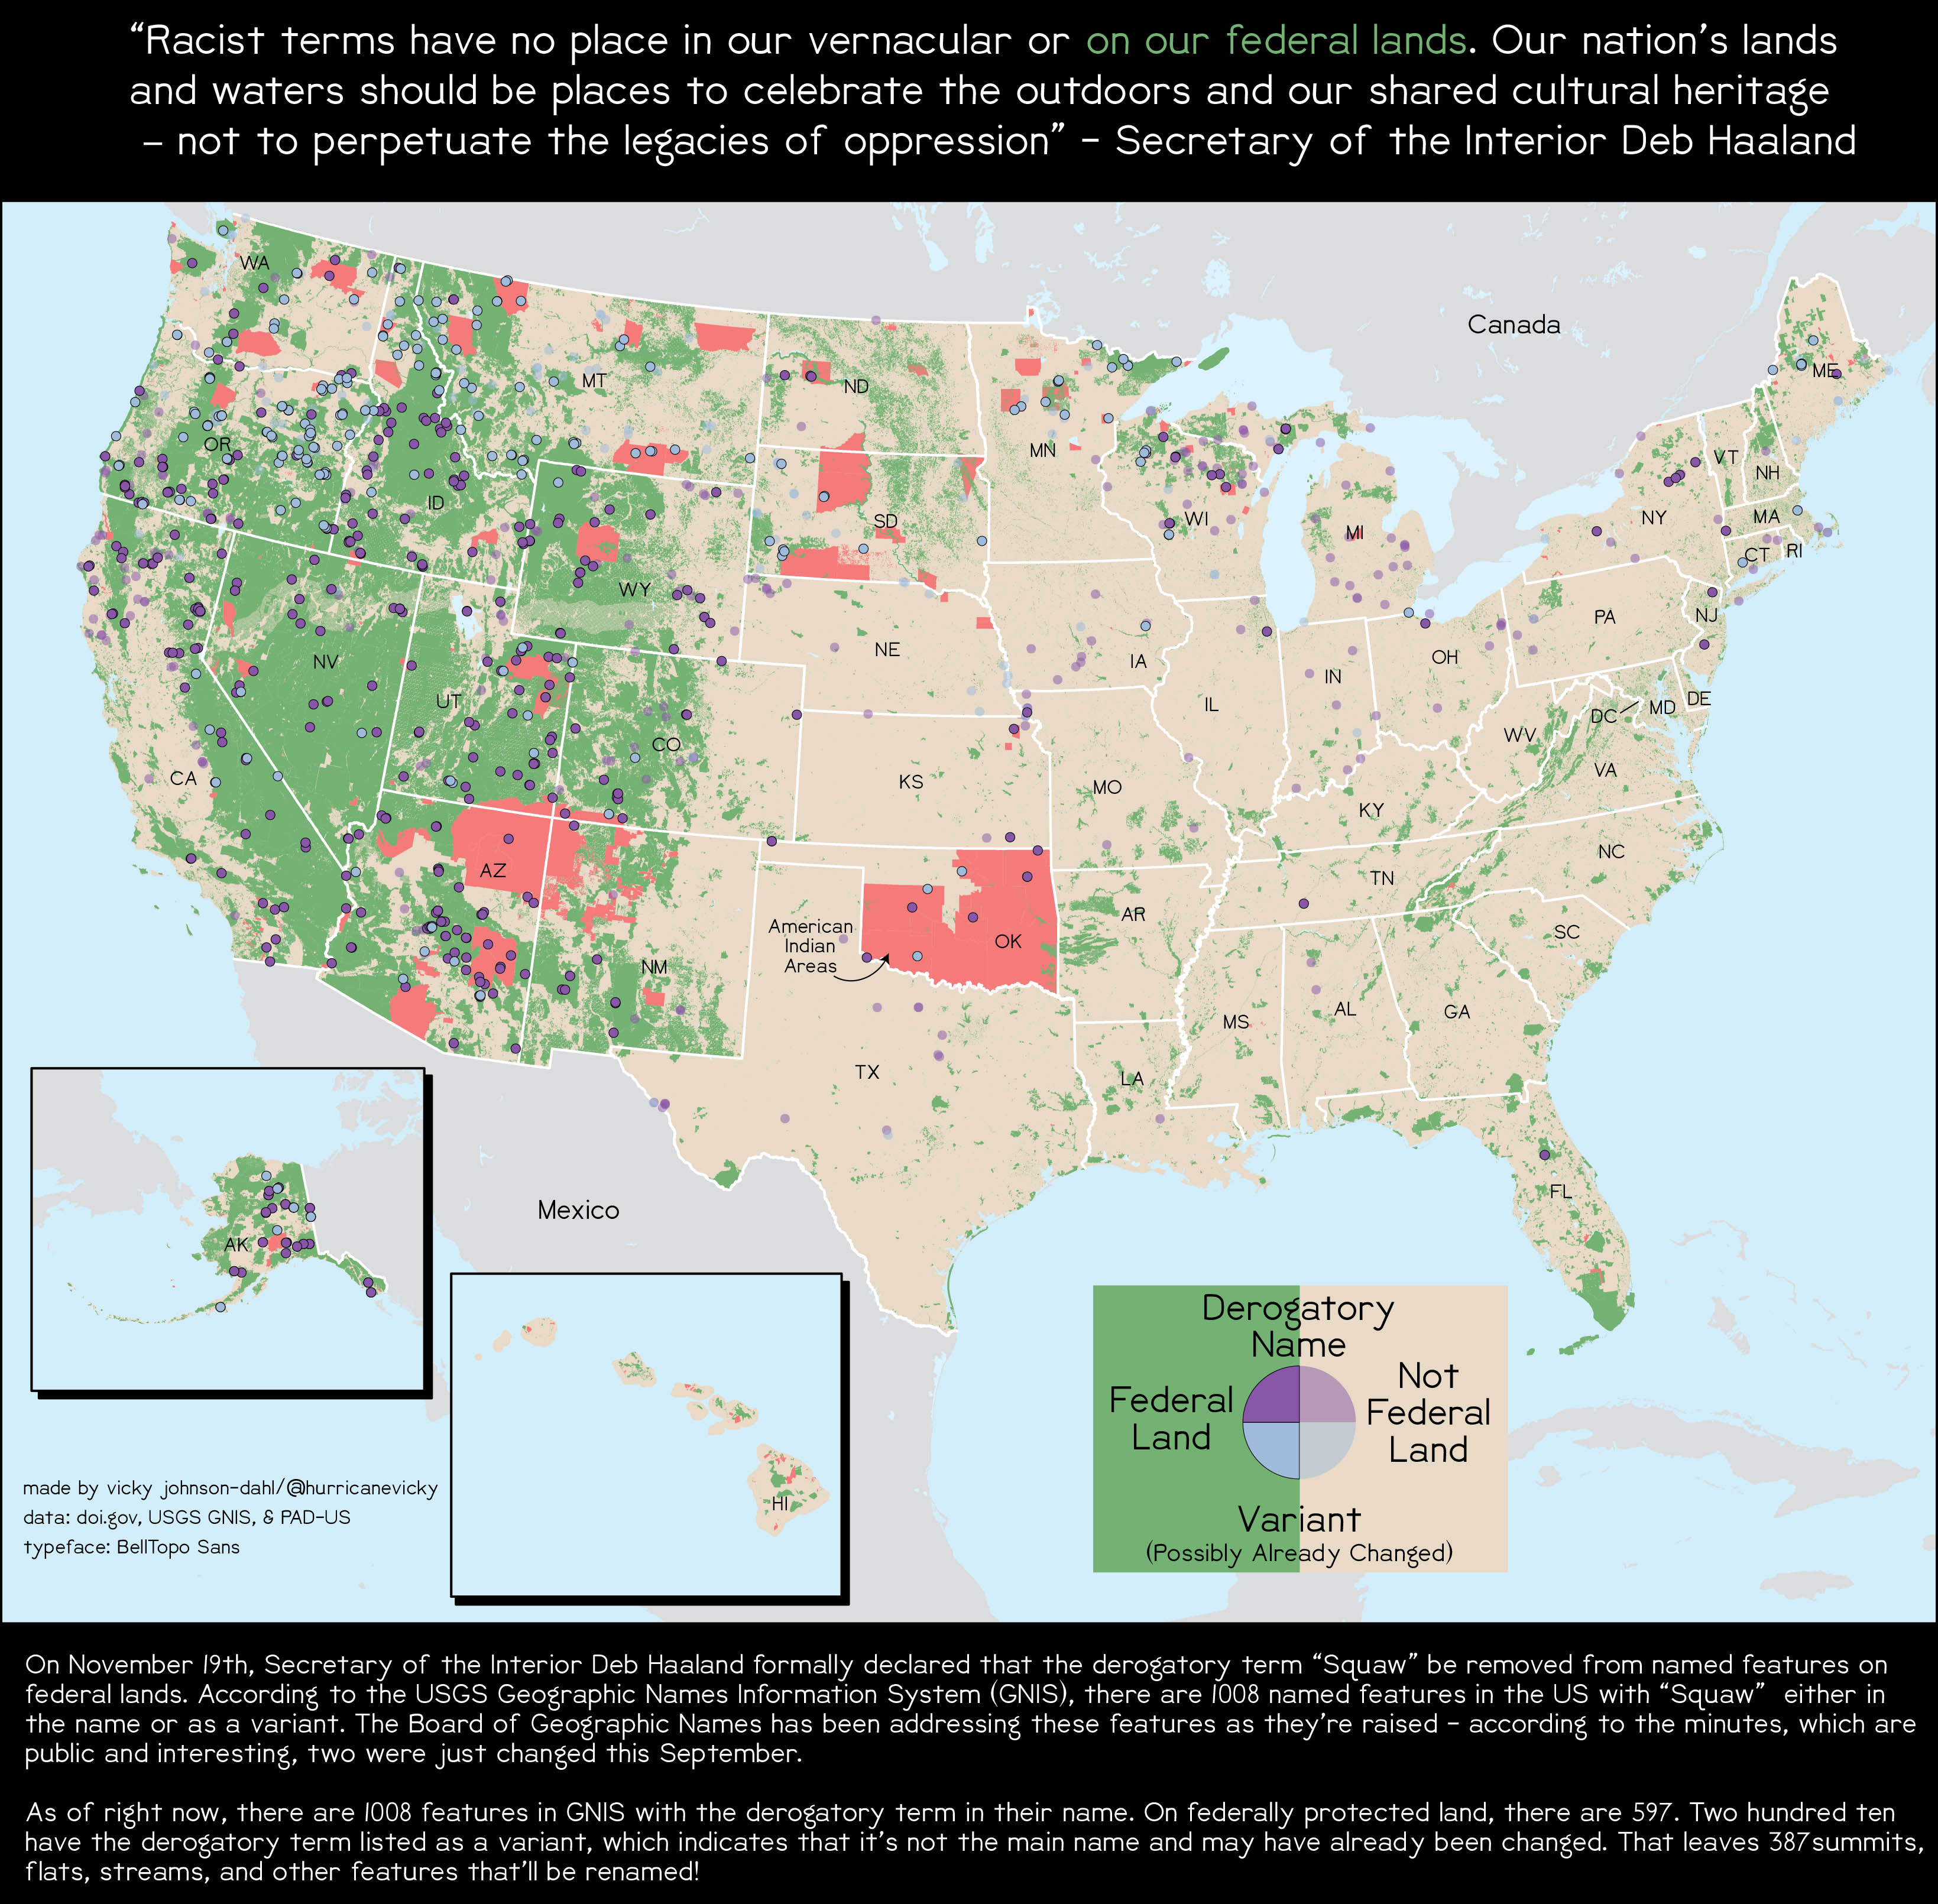 As a toponym modernization watcher(?) I was delighted by Secretary of the Interior Deb Haaland’s announcement that features on federal lands with a derogatory term in their name will be changed - so I mapped it.
Data from USGS GNS and PAD-US. Typeface is BellTopo Sans.
November 7, 2021: Green
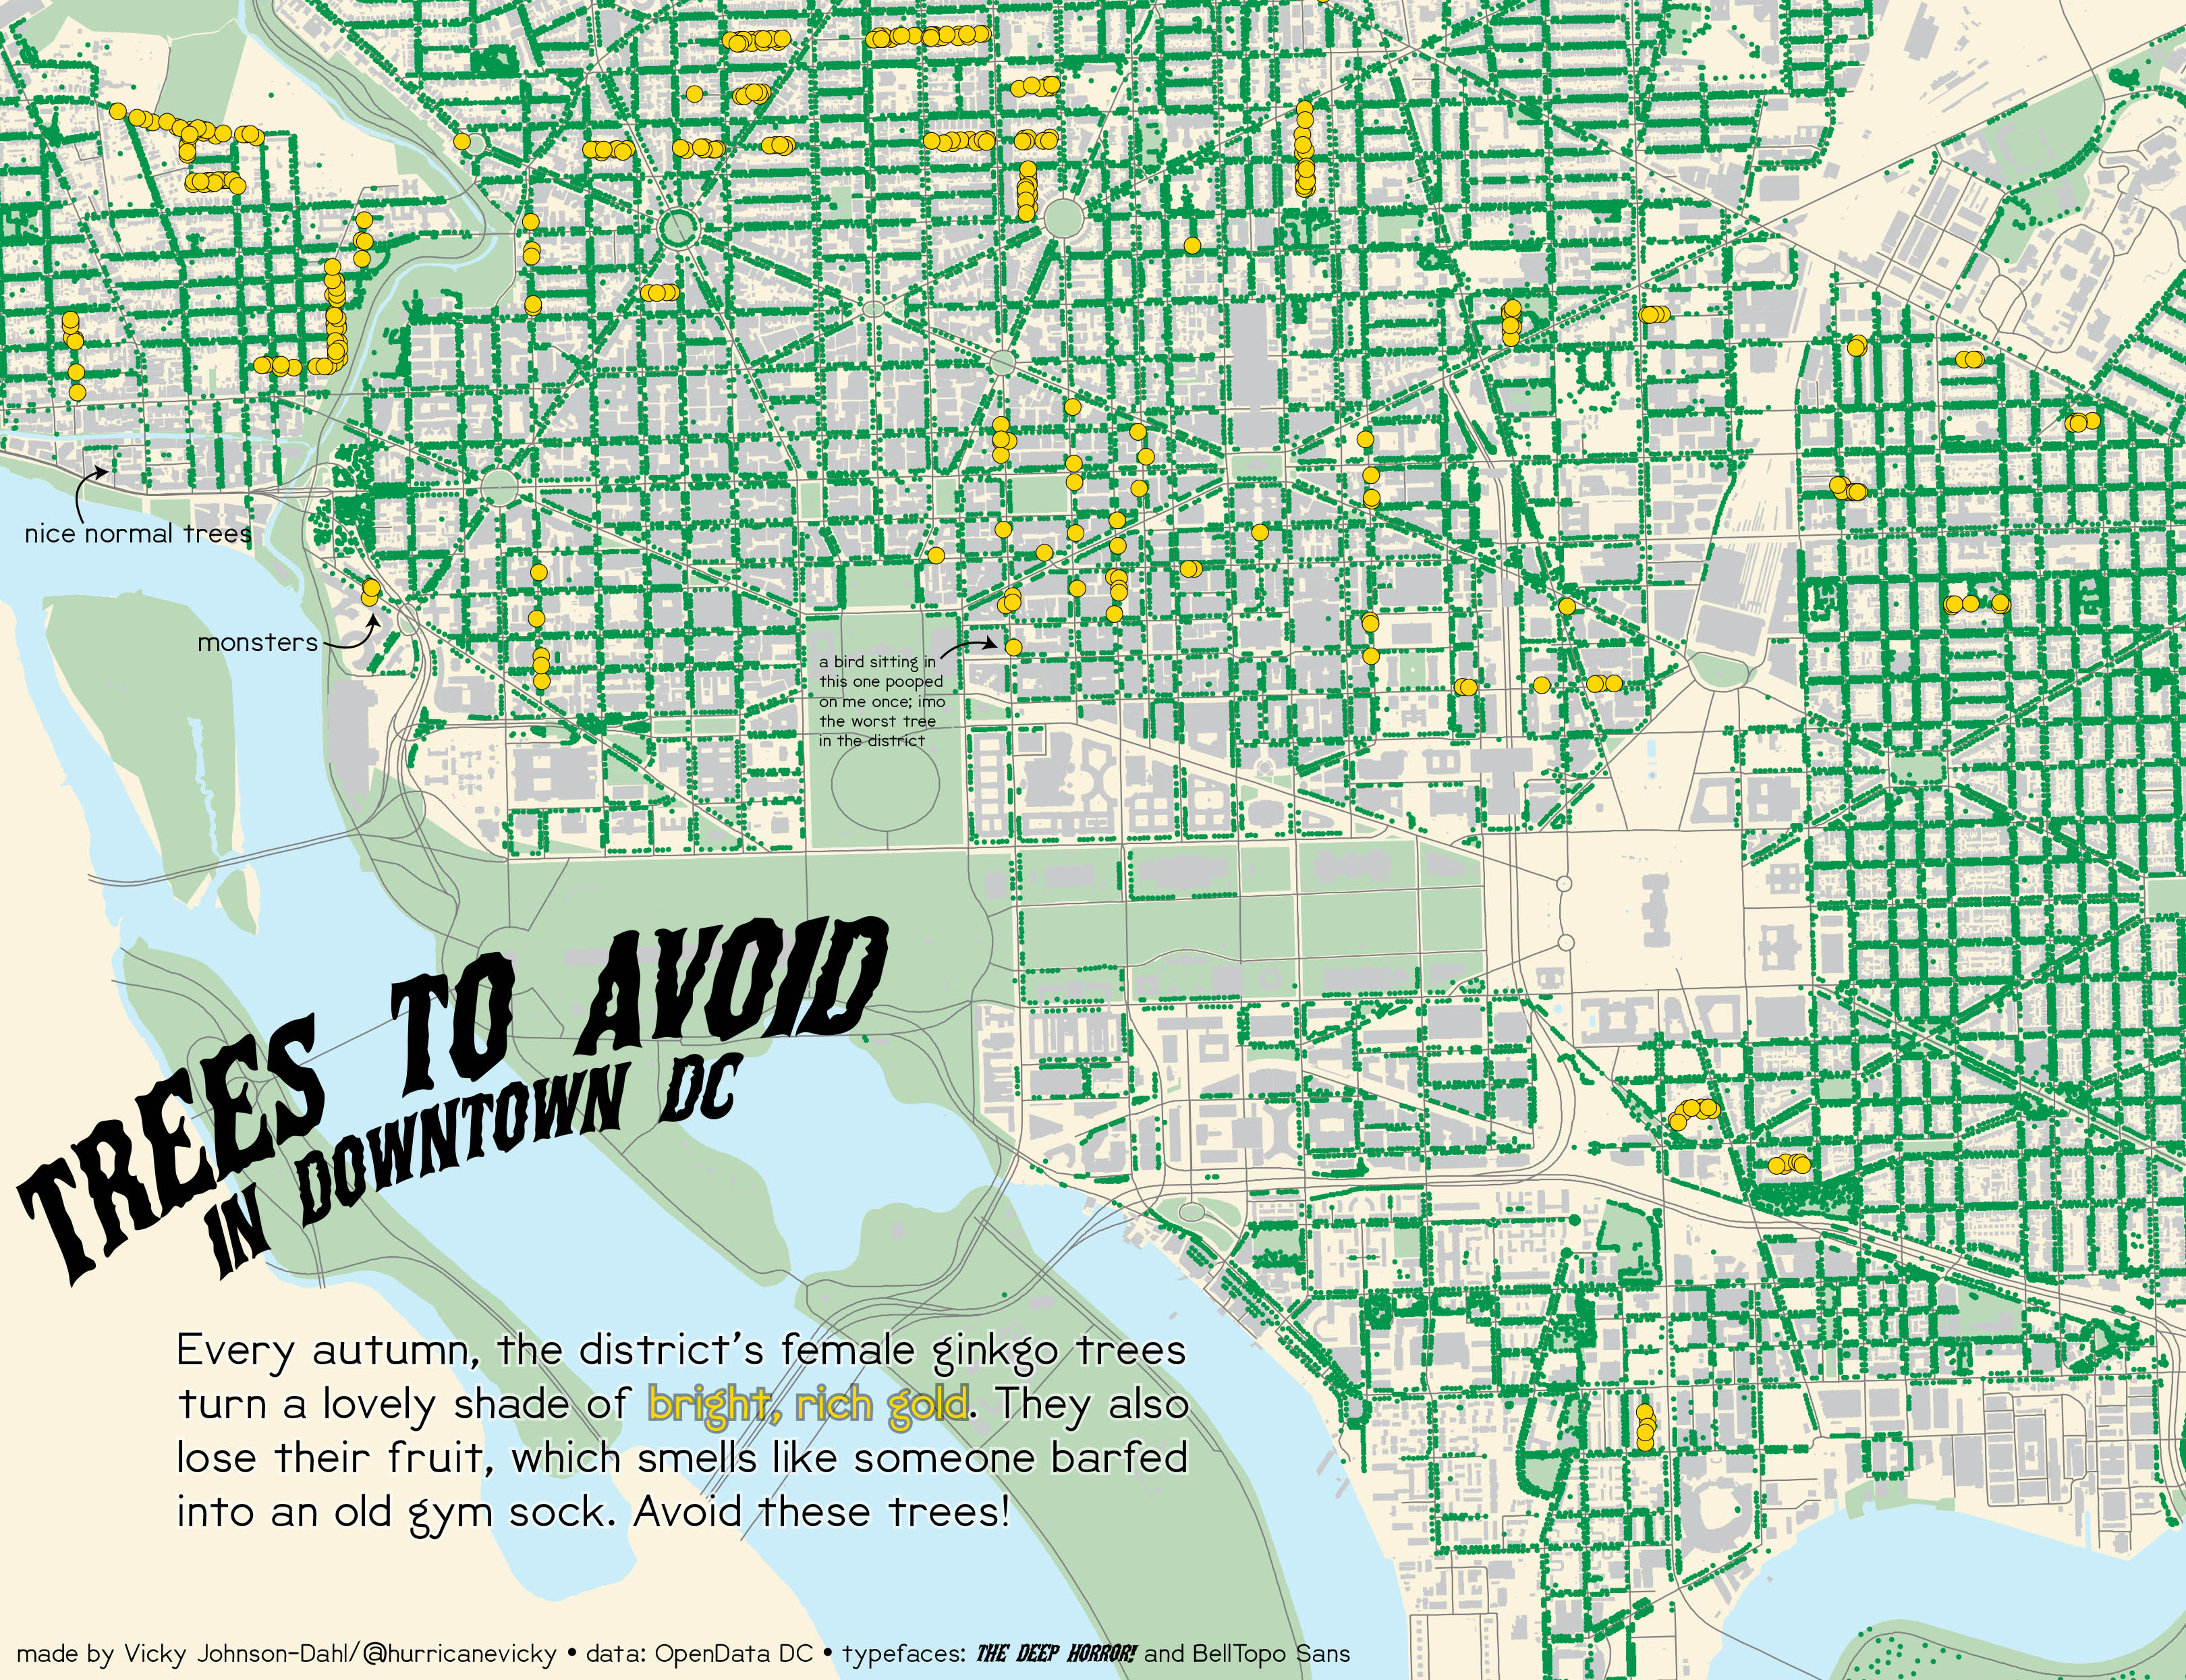 Trees I hate, one in particular.
Data from DC Open Data. Typefaces are The Deep Horror! and BellTopo Sans.
November 22, 2020: Movement
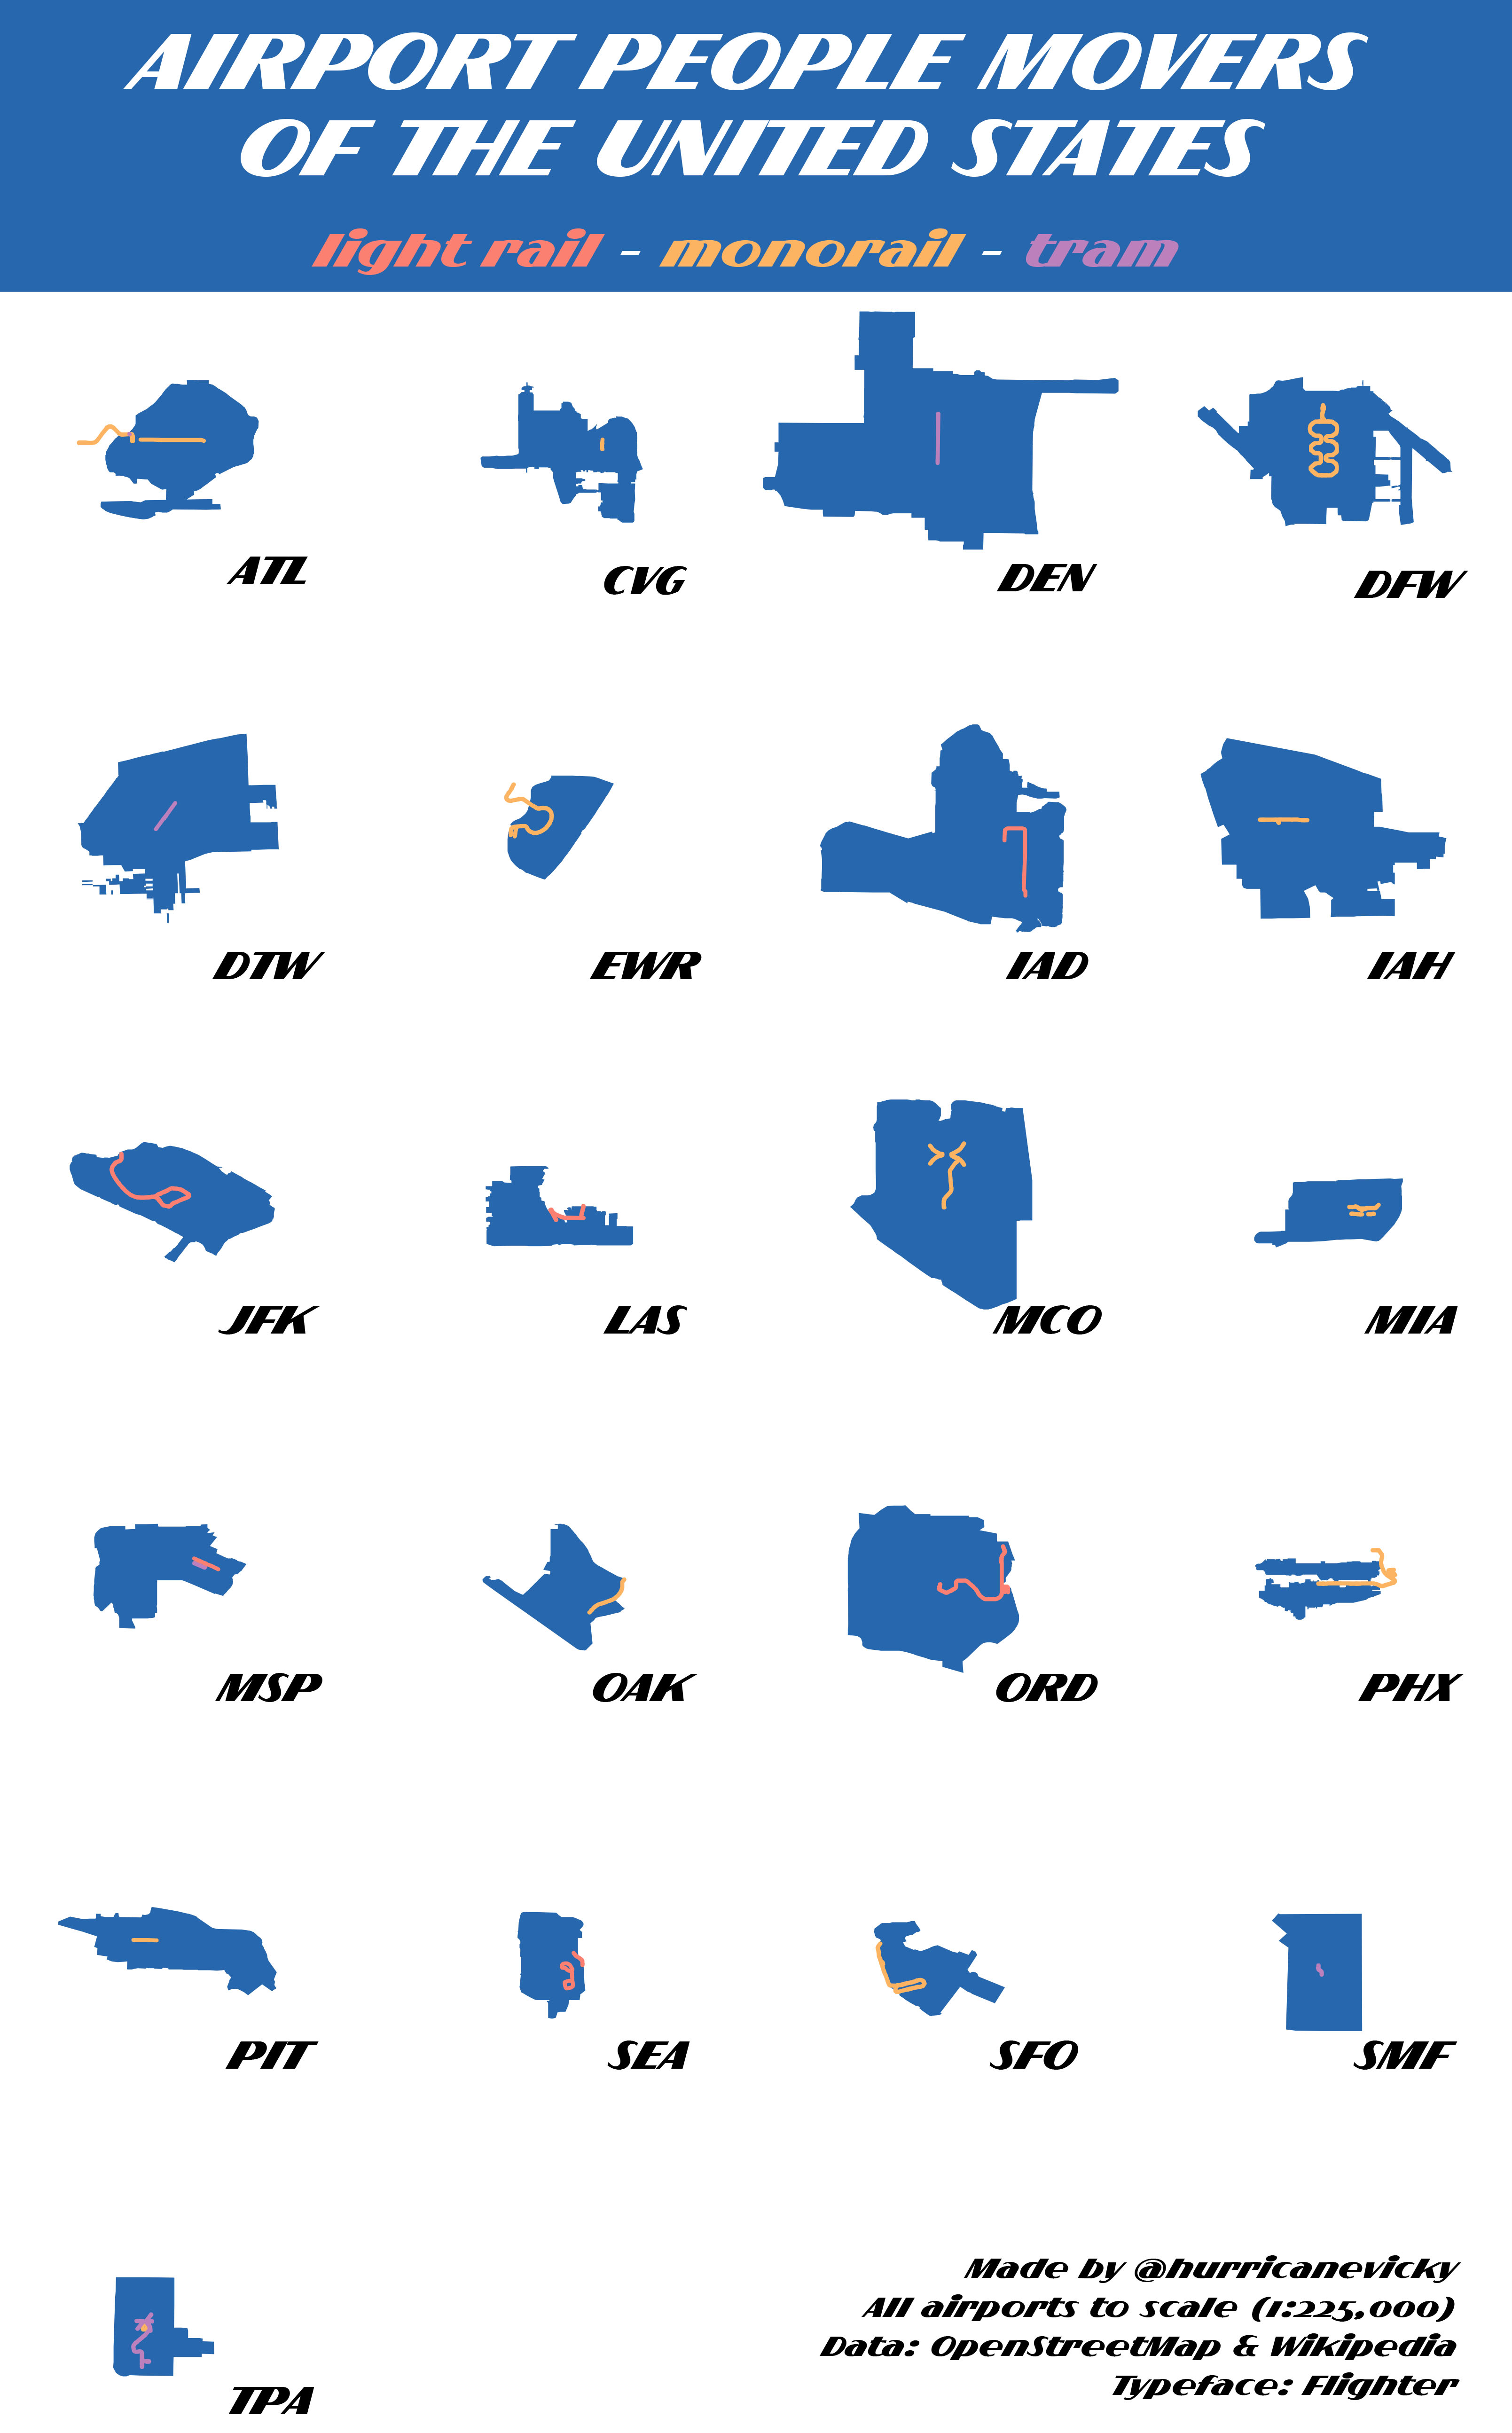 I found the challenge to be great for clearing out halfbaked ideas; this is another one I had been kicking around for a while (still to come someday, the atlas of lazy rivers?). The three types are how they are listed in OpenStreetMap. Couple of notes here:
1. Denver’s airport is HUGE. The blue polygons are the full airport extents (aerodrome OSM tag), all of them are shown at the same 1:225,000 scale. DEN is the second-largest airport in the world by land area (the first being King Fahd International in Saudi Arabia). It is 52 square miles, or a Manhattan and a half.
2. I used this list on wikipedia, active systems only, because you have to draw the line somewhere. The Dulles line is the AeroTrain, which means my boyfriend the utterly magnificent Dulles People Mover isn’t on it! Unrelated to the map but if you have ten minutes I recommend spending them with this ultracharming Charles and Ray Eames-produced video about it from 1958.
3. That is not an error the Minneapolis-St Paul airport has two independent parallel systems, a people mover and a tram.
4. Will do everything I can to avoid a traditional legend.
Data from OpenStreetMap and this wiki list of airport people mover systems. Typeface is Flighter.
November 18, 2020: Landuse
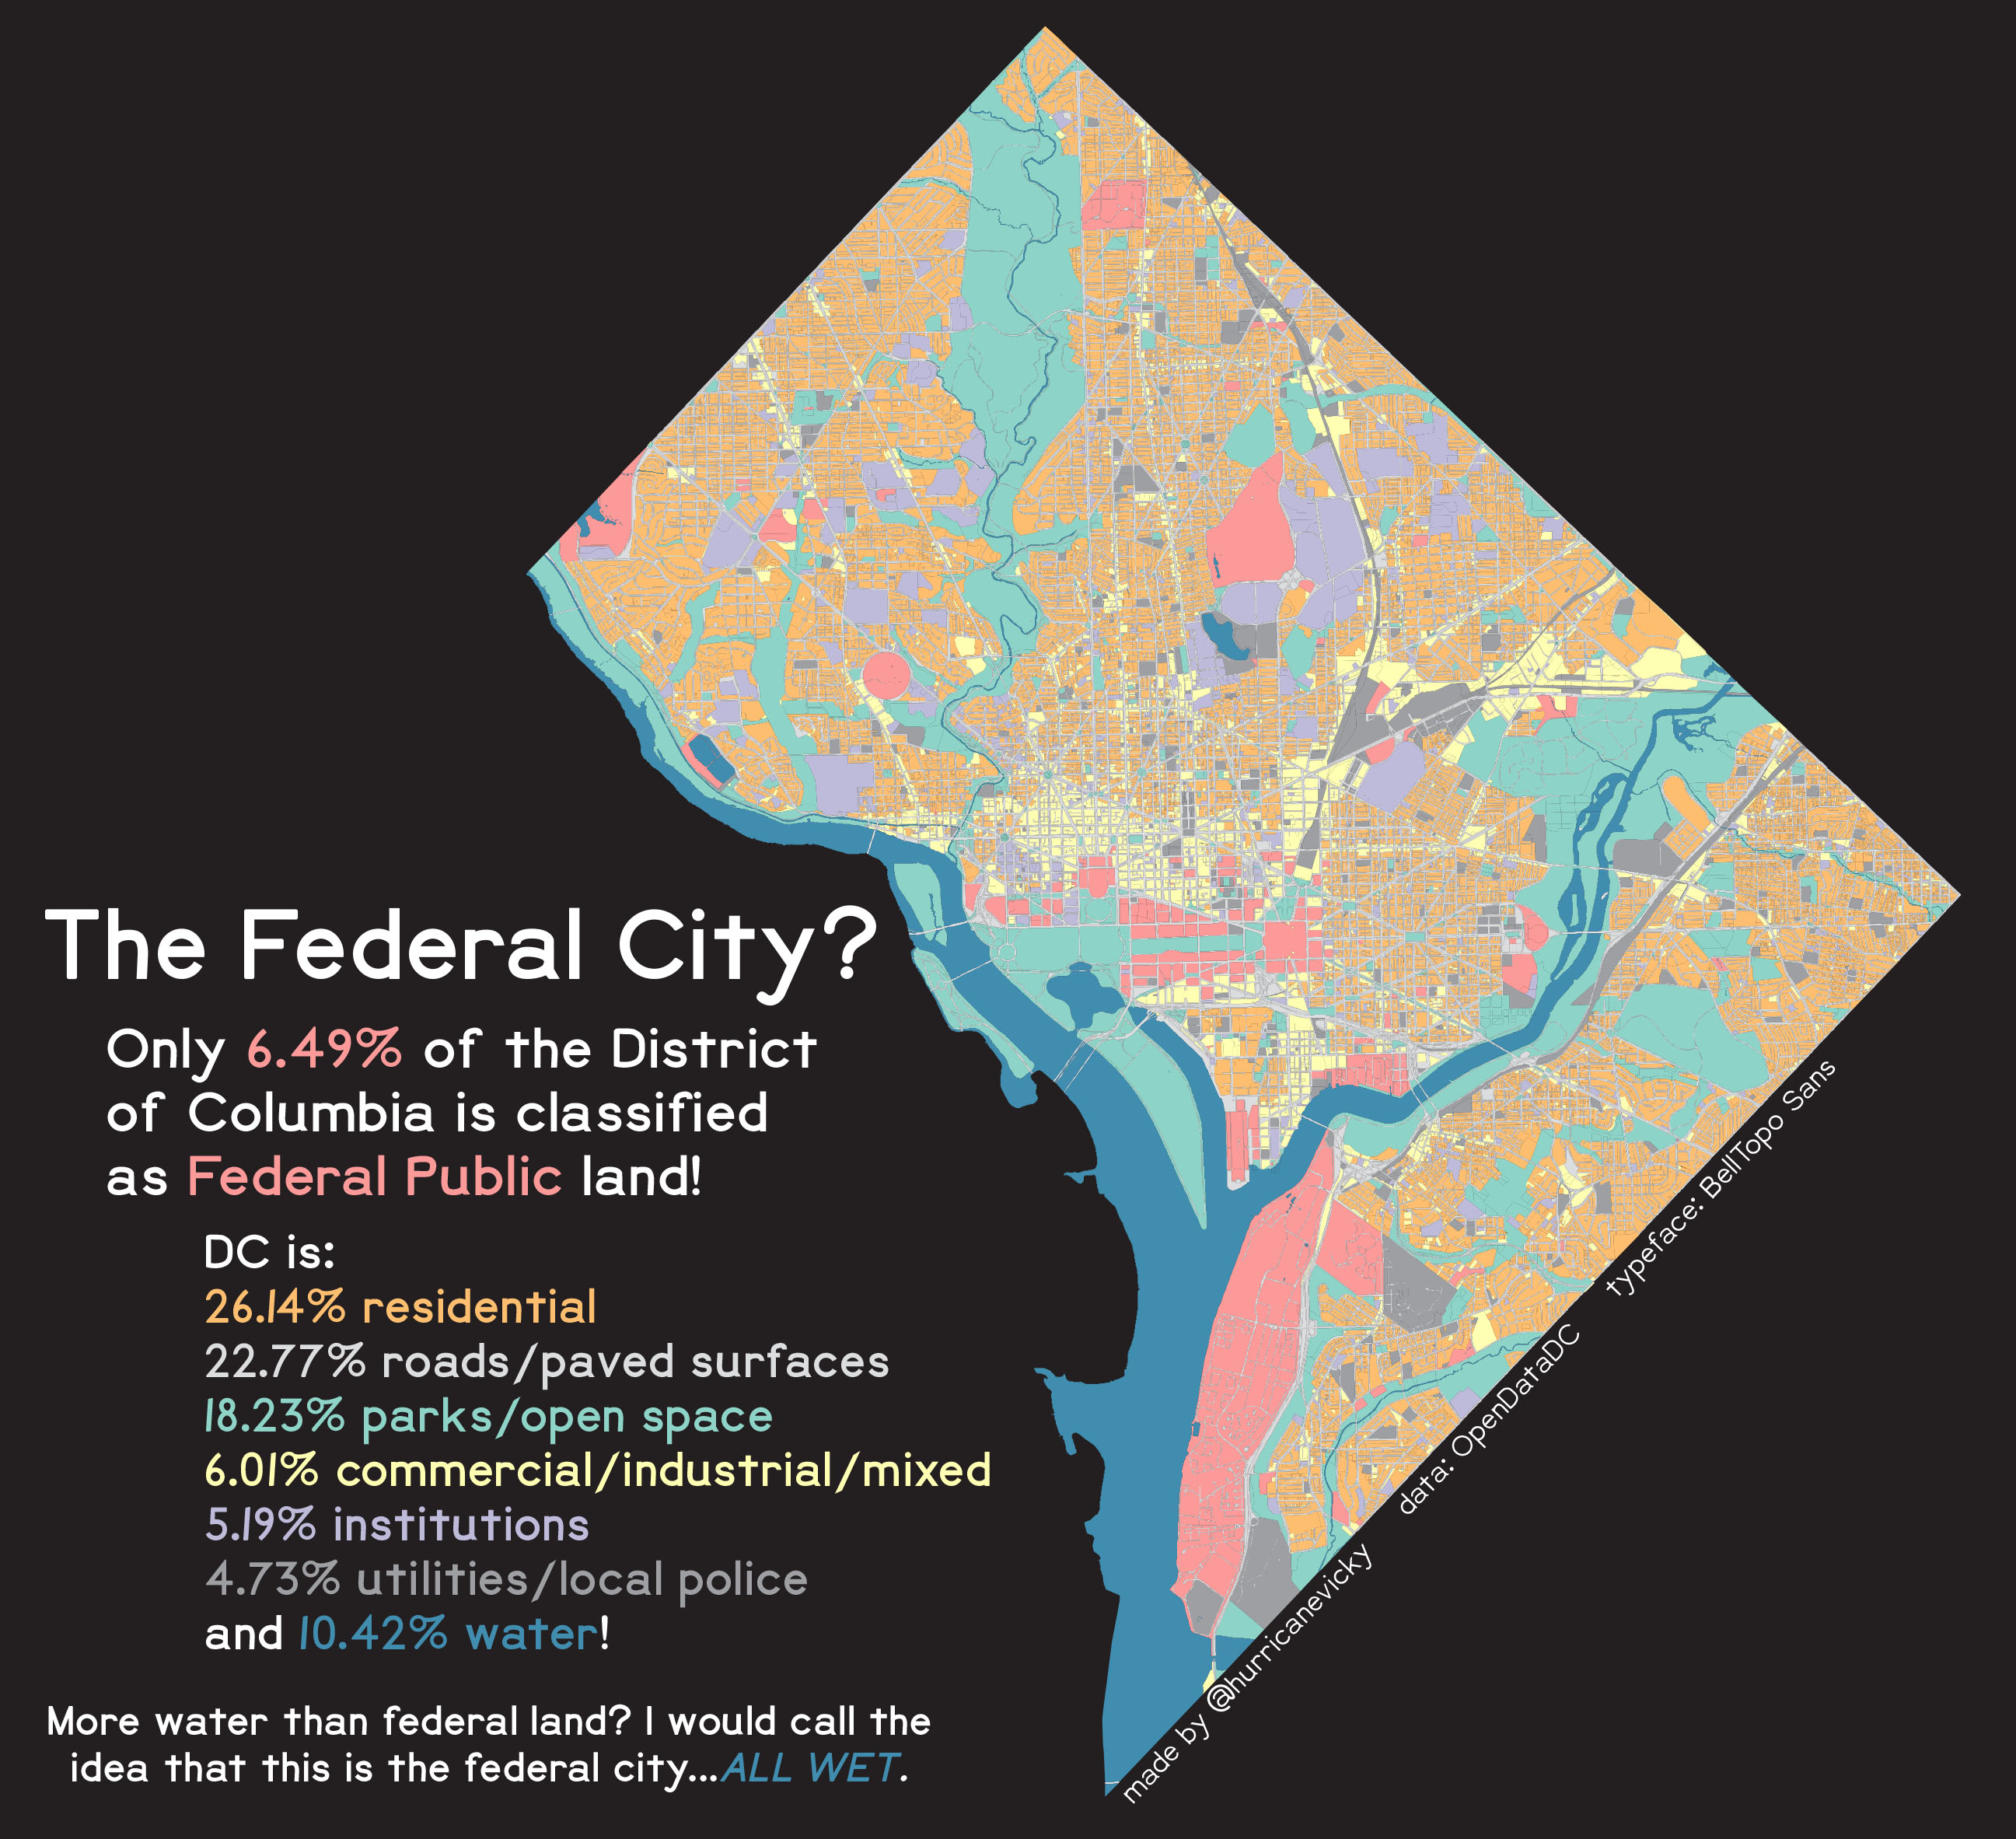 I really love the DC Open Data portal and how much information about the structure of my city is freely accessible in a variety of formats. I think about broader public perceptions of the District a lot, probably too much, and I am an insufferable windbag about correcting people who use ‘DC’ as shorthand for Congress, particularly when complaining about it, because the object of their metonymy has no voting representation in the body they’re complaining about!!! Ahhh!!!!! So for this one I grabbed the Existing Land Use dataset from DCOD, combined a few logical categories (rivers, lakes, and canals became ‘water,’ for example) and put them on a map that imo looks rather nice. As the dataset included area for each polygon, a little math - thank u Heidi, patron saint of the pivot table - gave me the percentage of the District in each category to underline the purpose of this map, which is that DC is only a small percent federal, it is a normal city, people live and work here outside of national politics. One afterthought, I would like to see similar maps of areas with a big federal or military presence, just to see how we compare.
Data from DC Open Data. Typeface is BellTopo Sans.
November 10, 2021: Raster
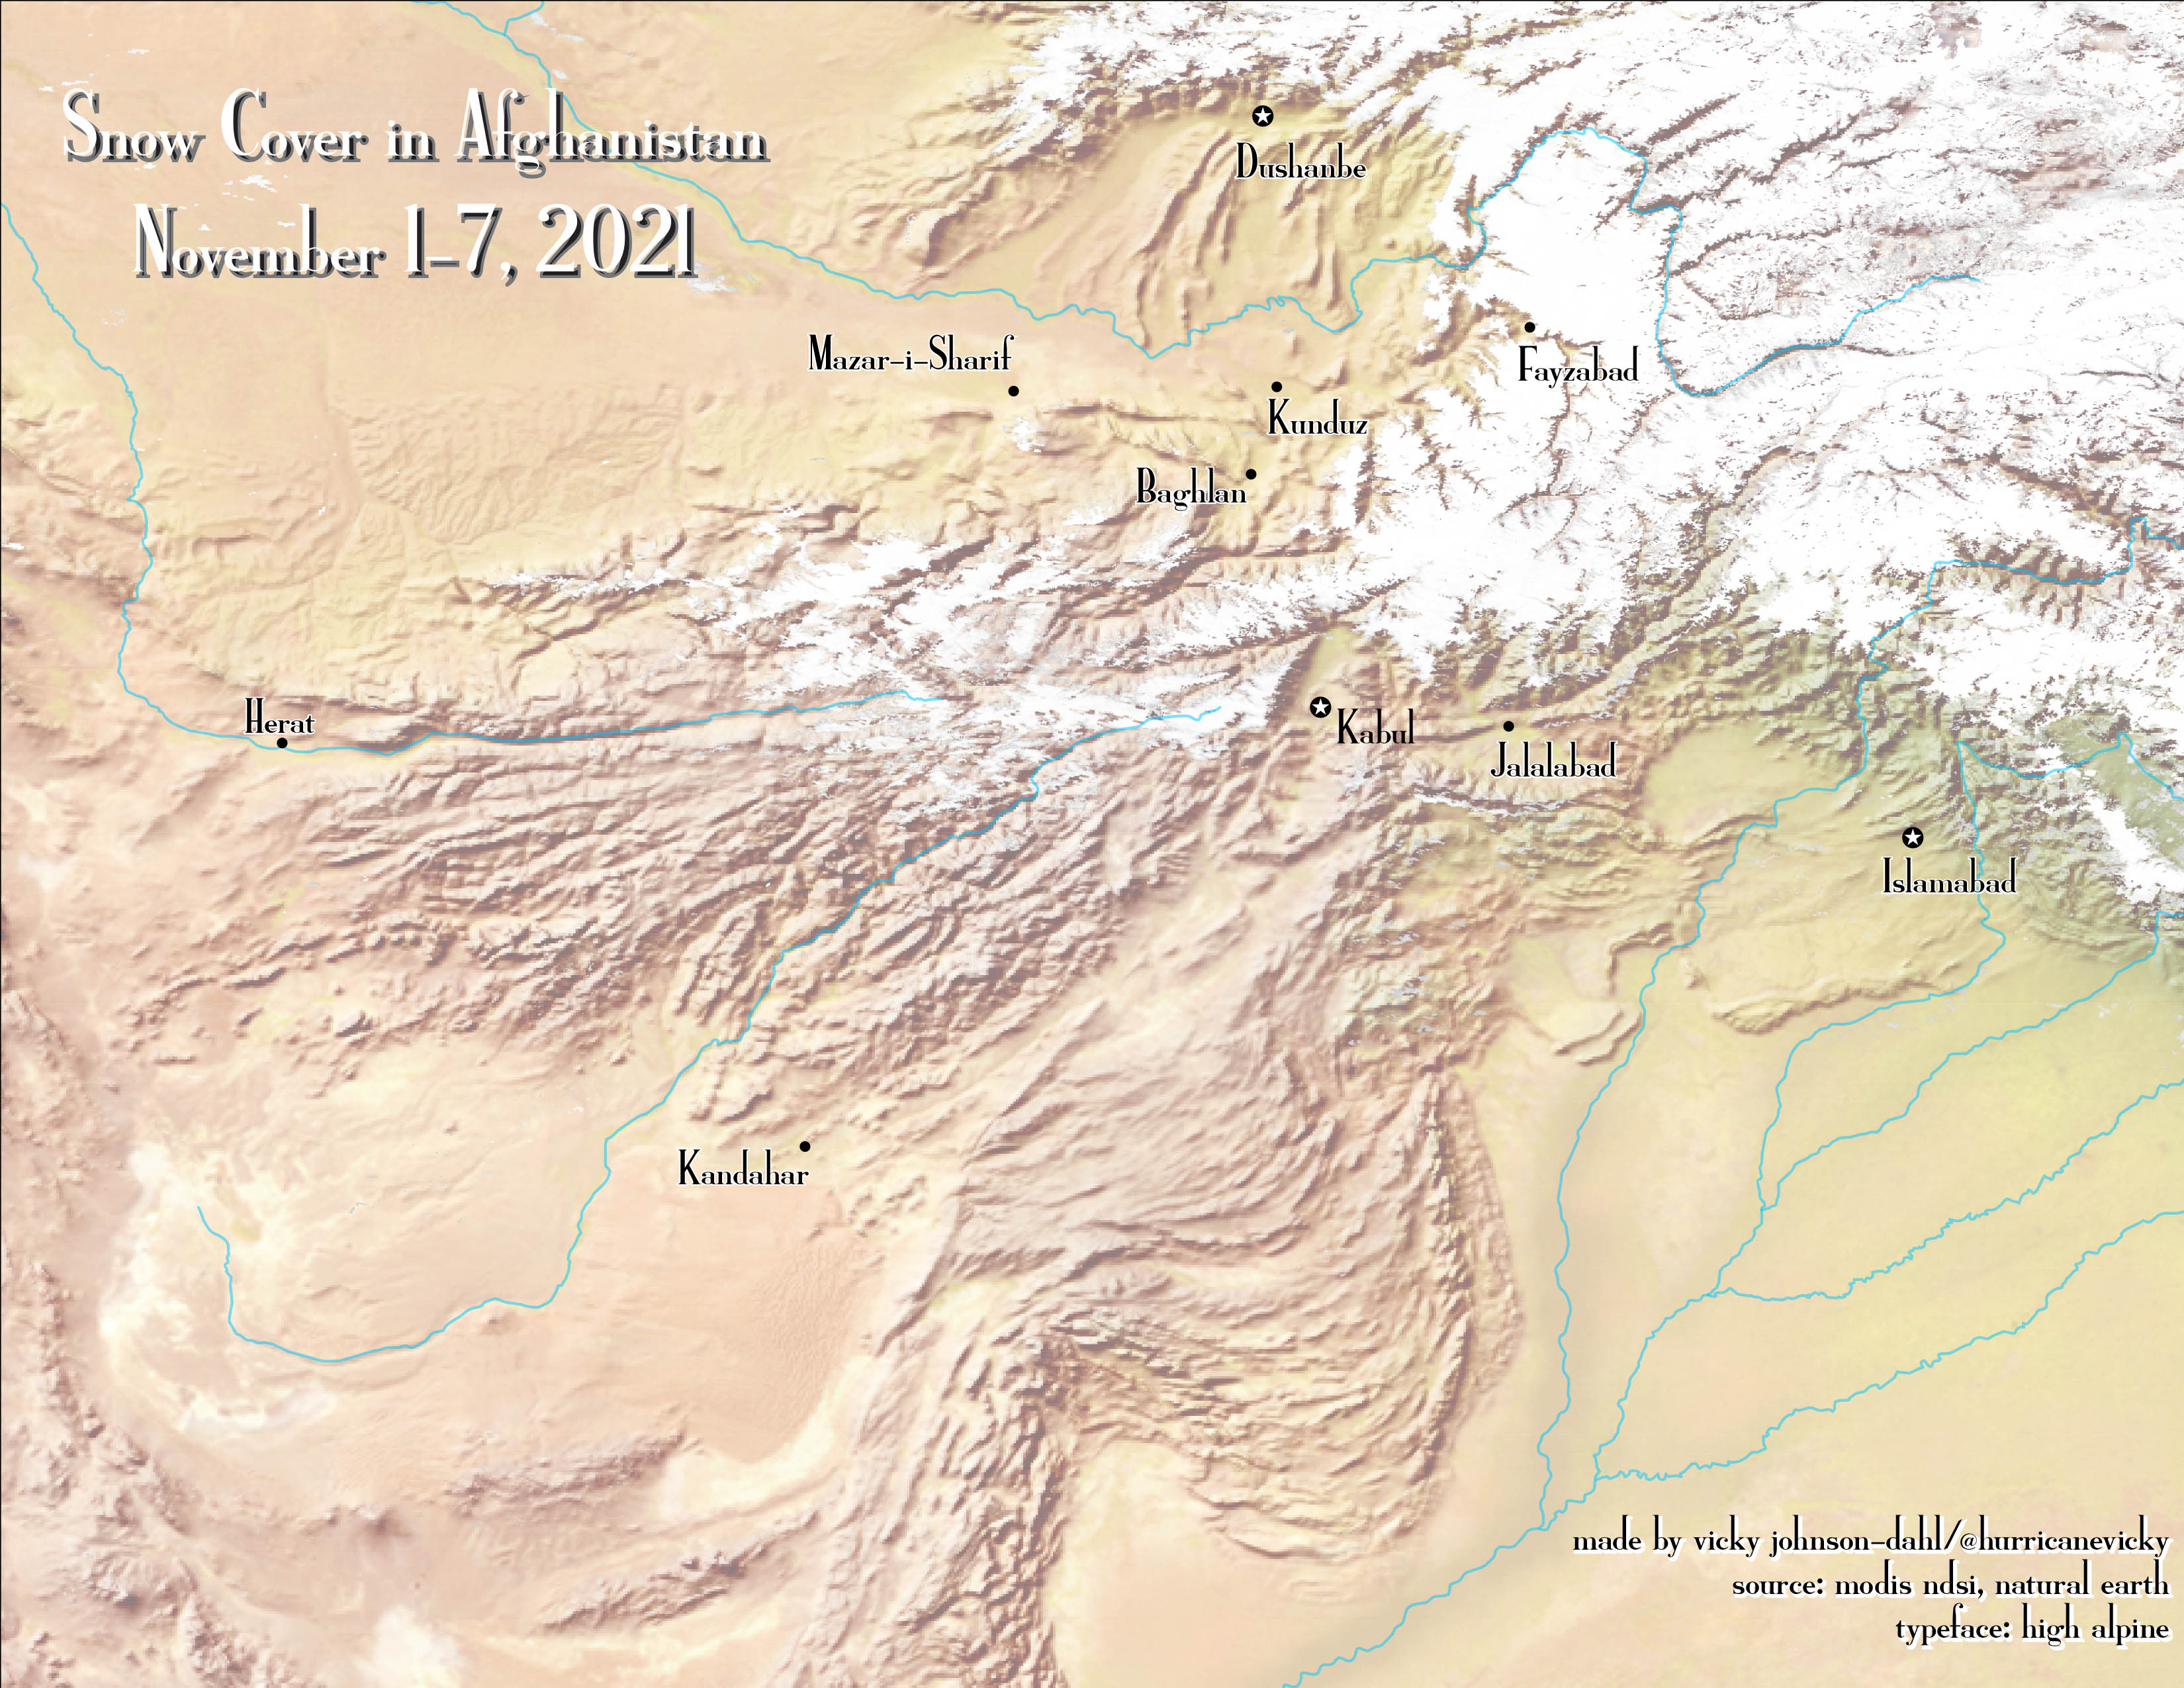 I wrote a little script in Google Earth Engine for this one, a composite of MODIS snow cover data in Afghanistan for the previous week. Deliberately left the borders off of this one, I think it’s really interesting how much of the country’s shape can be discerned based on landscape alone!
Data from the MODIS and Natural Earth. Typeface is High Alpine.
November 14, 2020: Climate Change
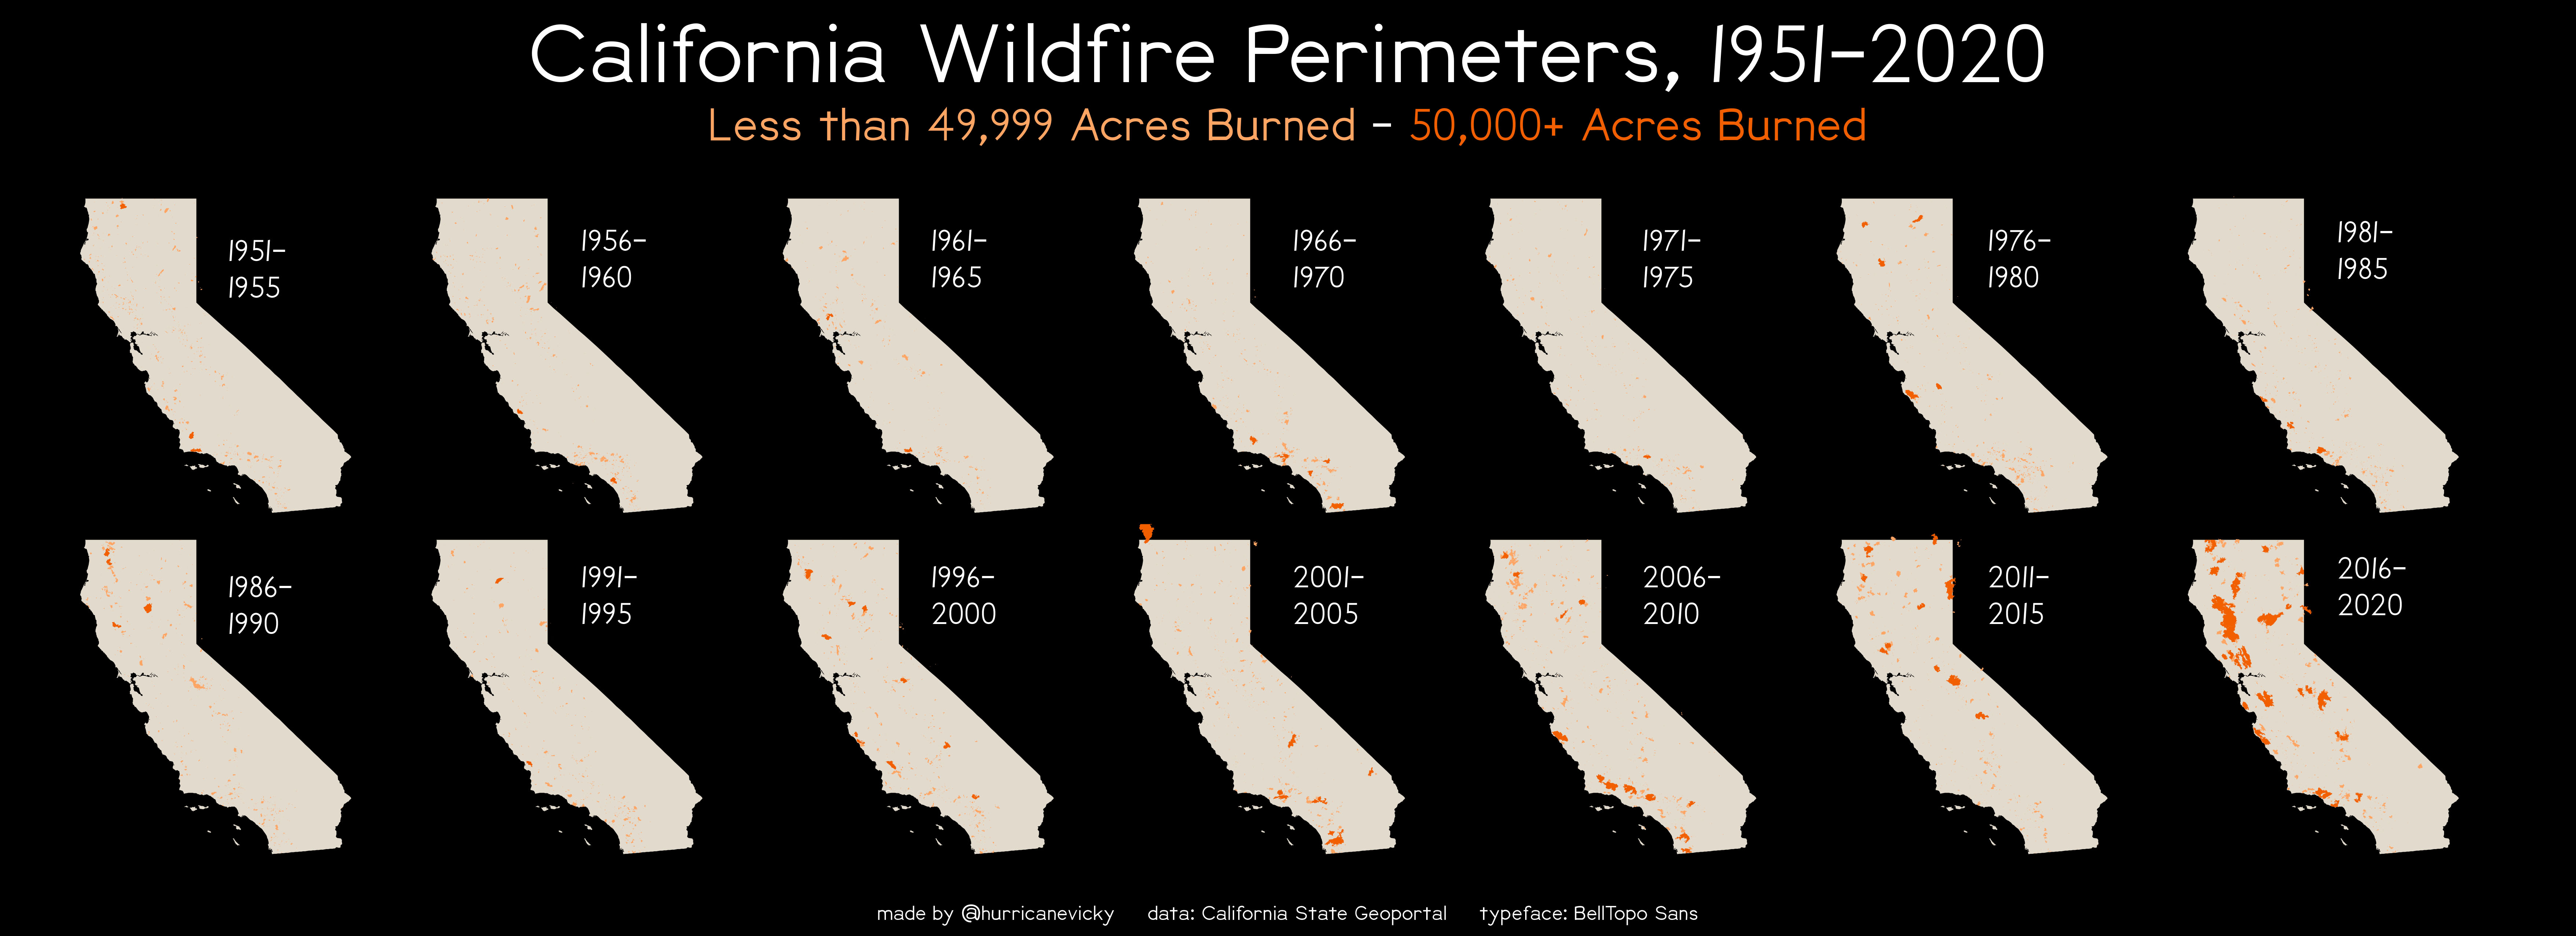 For the challenge’s climate change day, I mapped the past 70 years of wildfires in California, five years at a time. Not much to say here. Bleak. This map is more detailed than it appears at first glance, clicking the image will open it larger in a new tab.
Data from the California State Geoportal and Natural Earth. Typeface is BellTopo Sans.
November 4, 2020: Hexagons
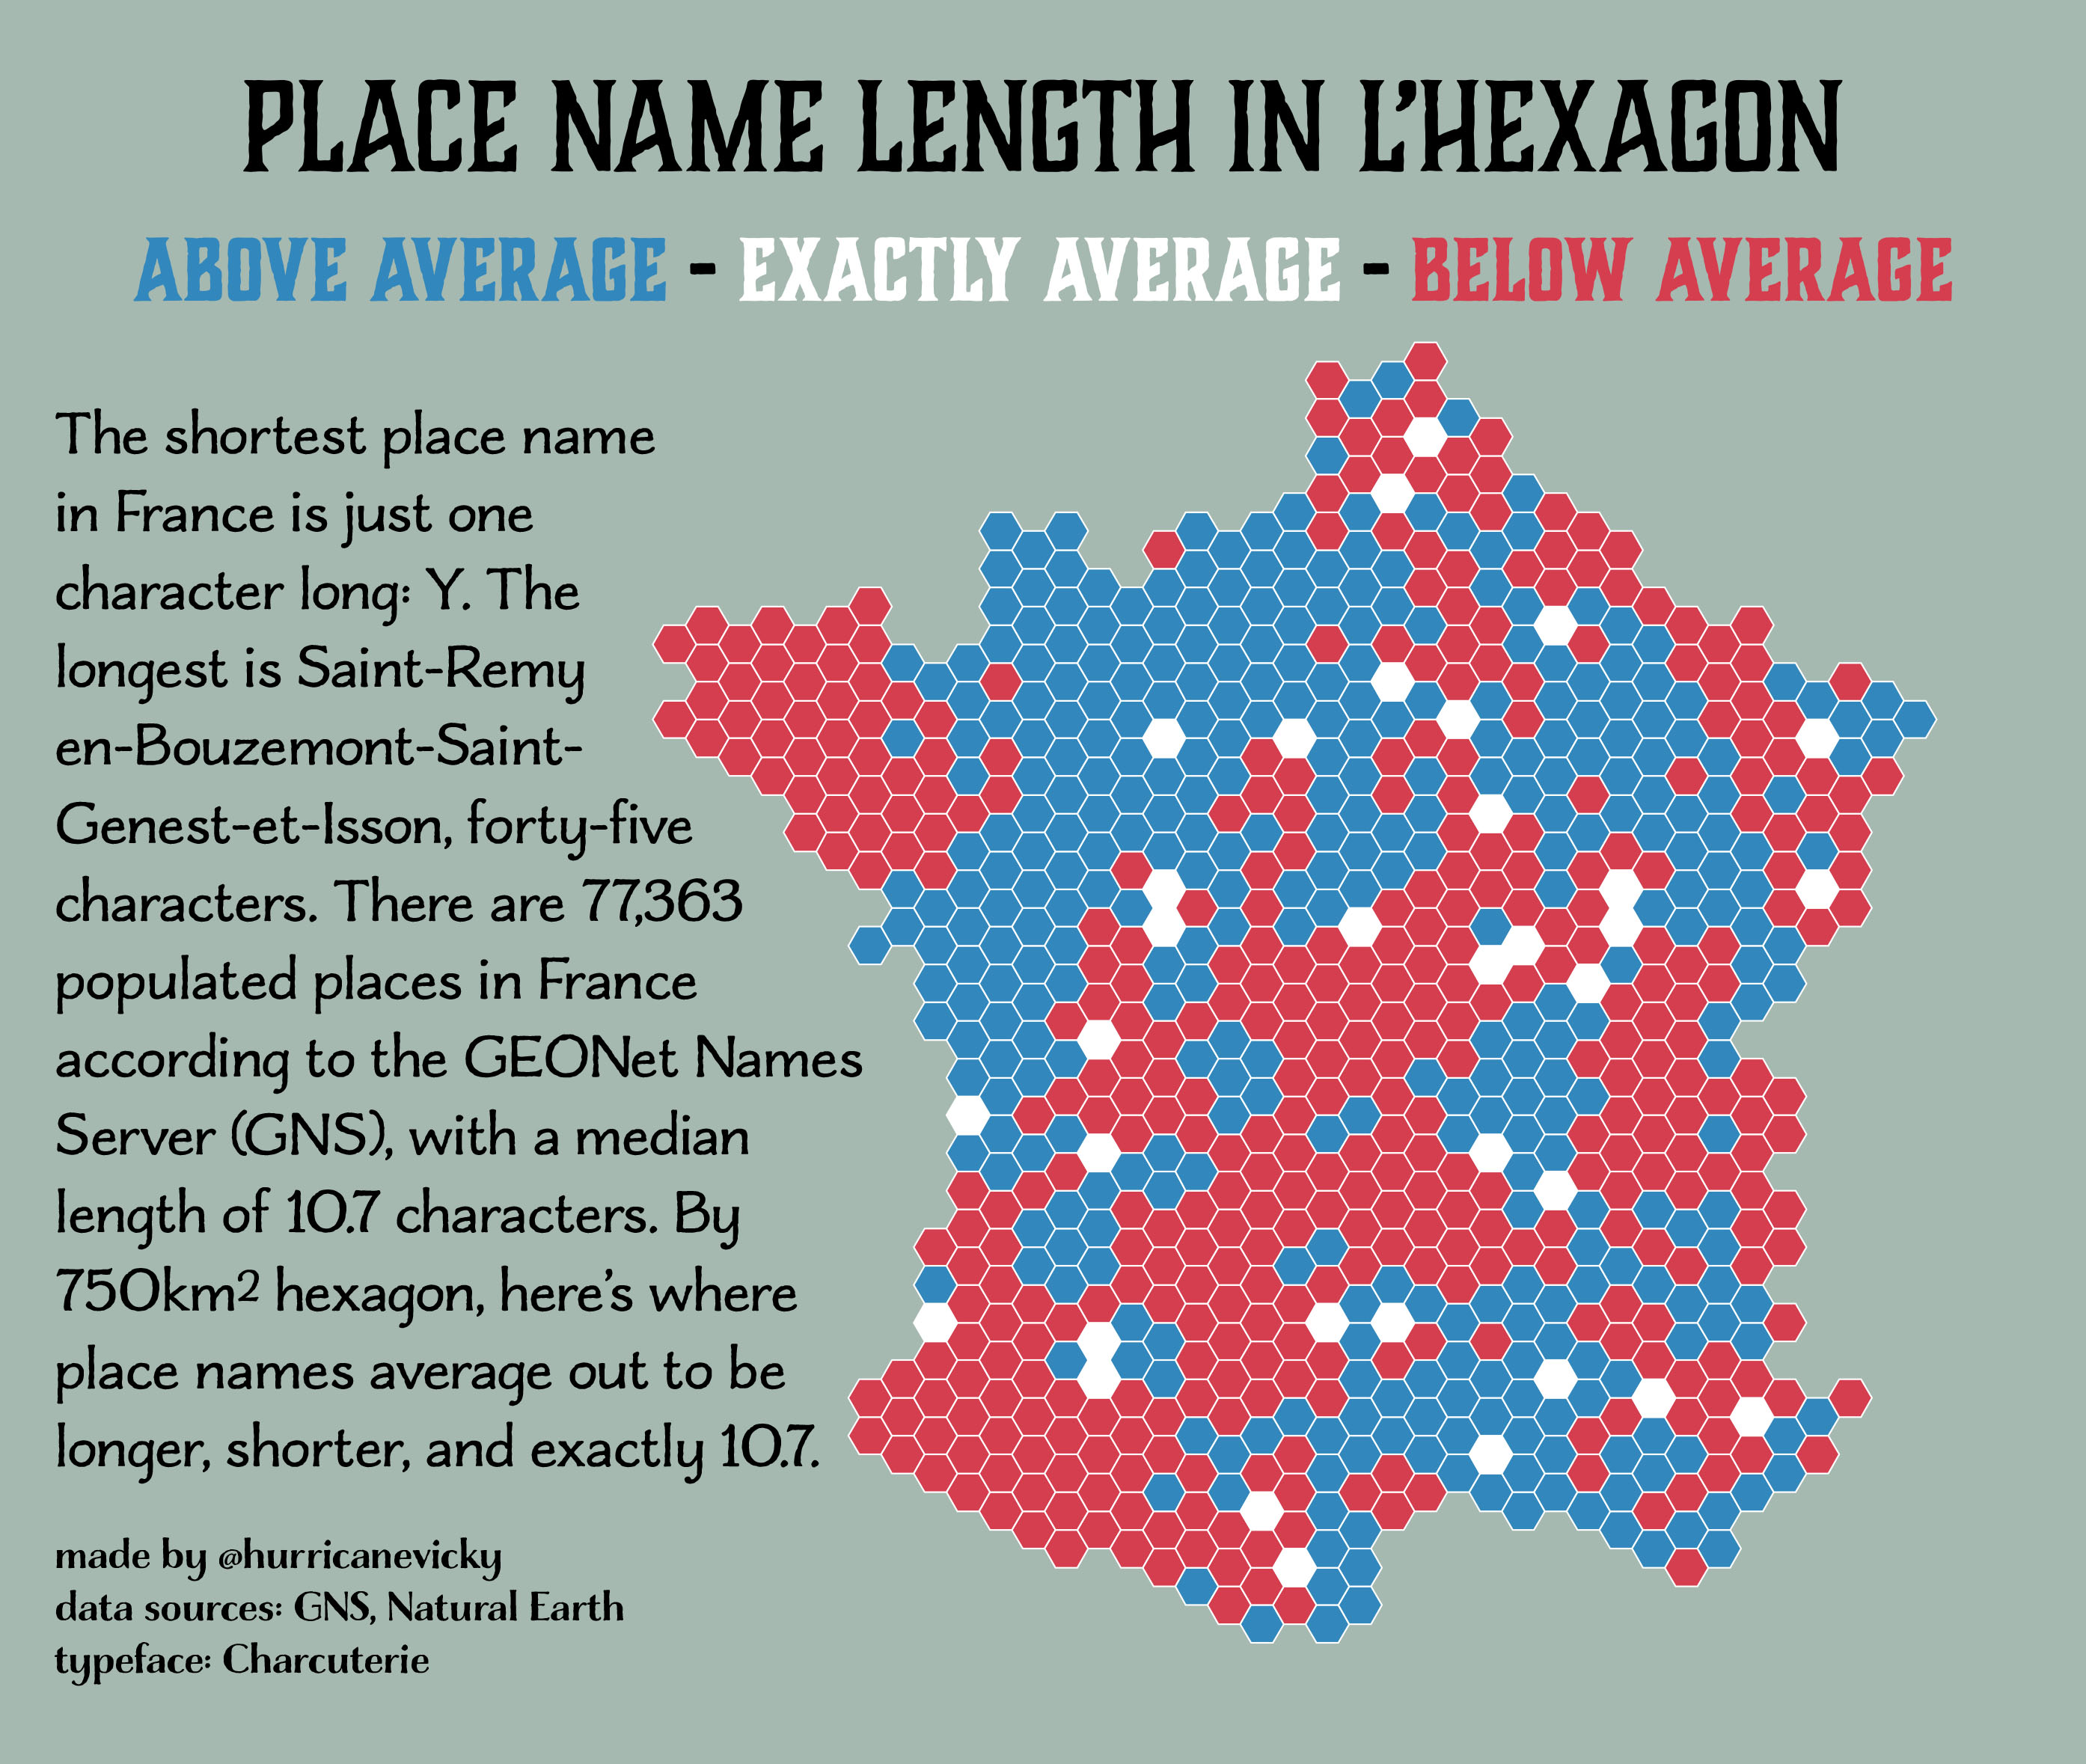 This one started out as something else entirely but I am simply too committed to dumb and pointless mapping.
Data from GNS and Natural Earth, typeface is Charcuterie.
November 4, 2021: Hexagons
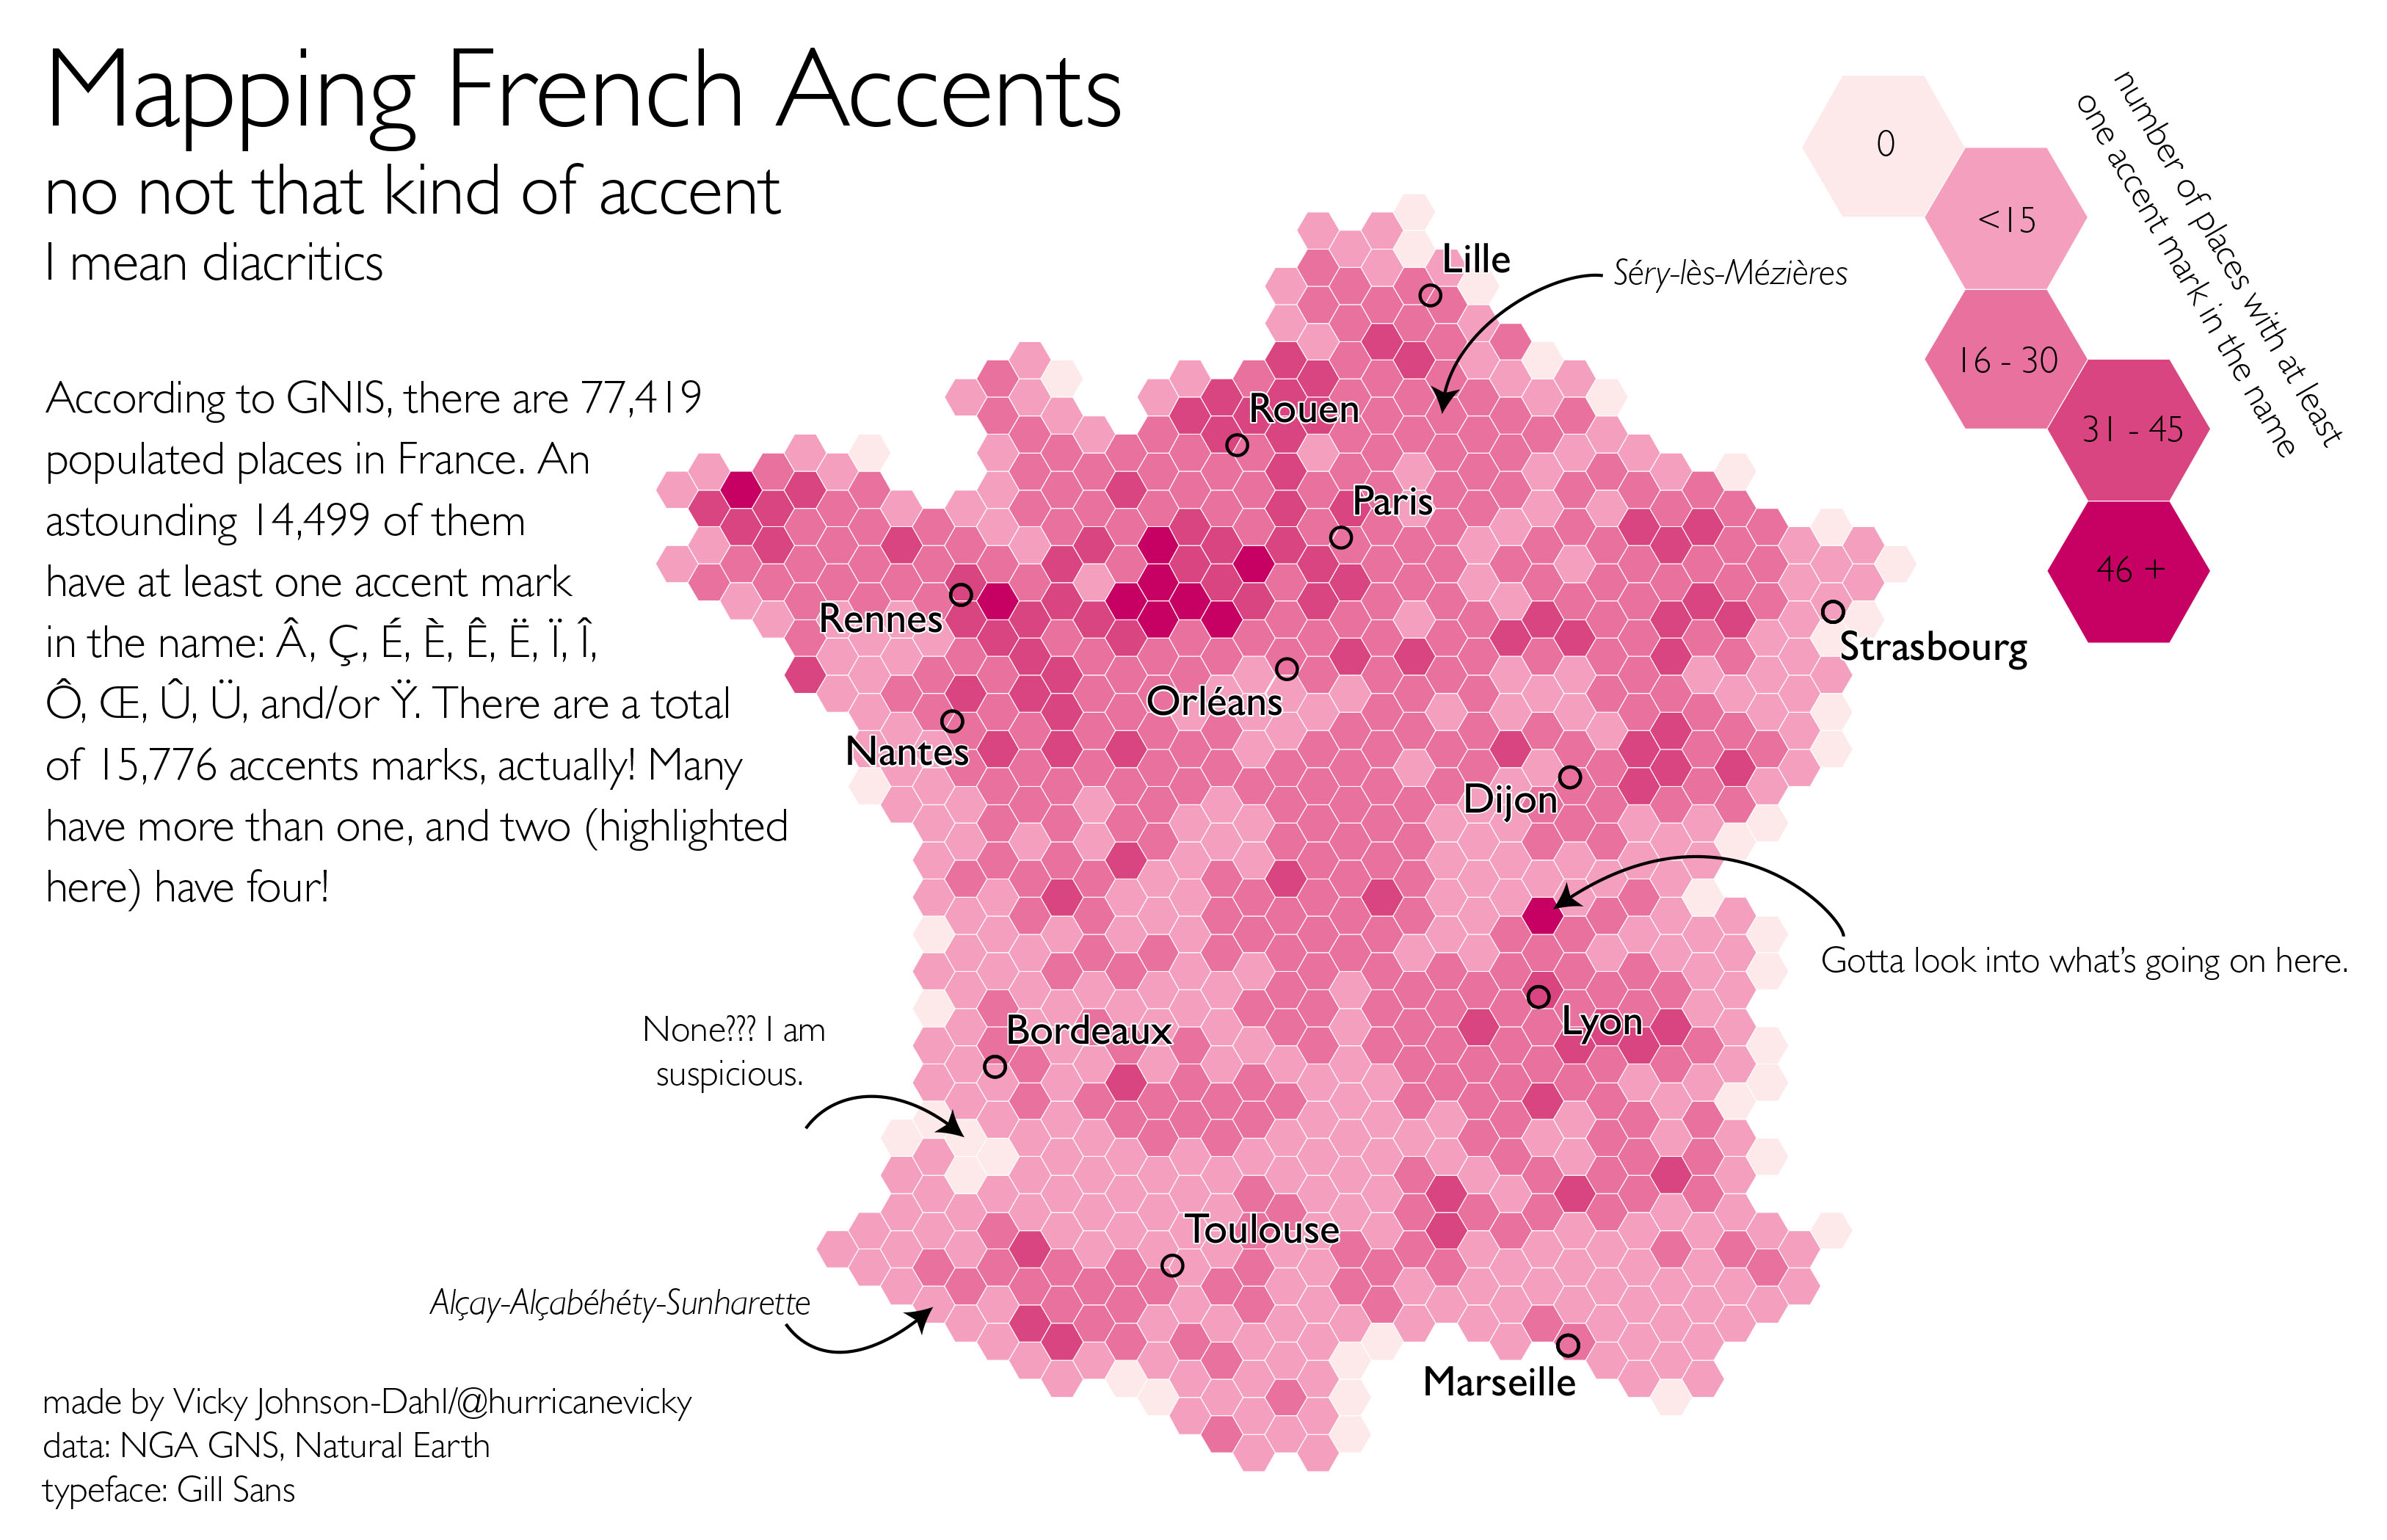 L’Hexagon again for 2021!
Data from GNS and Natural Earth, typeface is Gill Sans</a>.
November 2, 2020: Lines
 Rarely - only twelve times since 1953 - a storm will cross over from the Atlantic to the Pacific basin (or vice versa).
Data from NOAA’s National Centers for Environmental Information, Natural Earth, and Wikipedia. Typeface is BellTopo Sans.
November 30, 2021: Meta-mapping
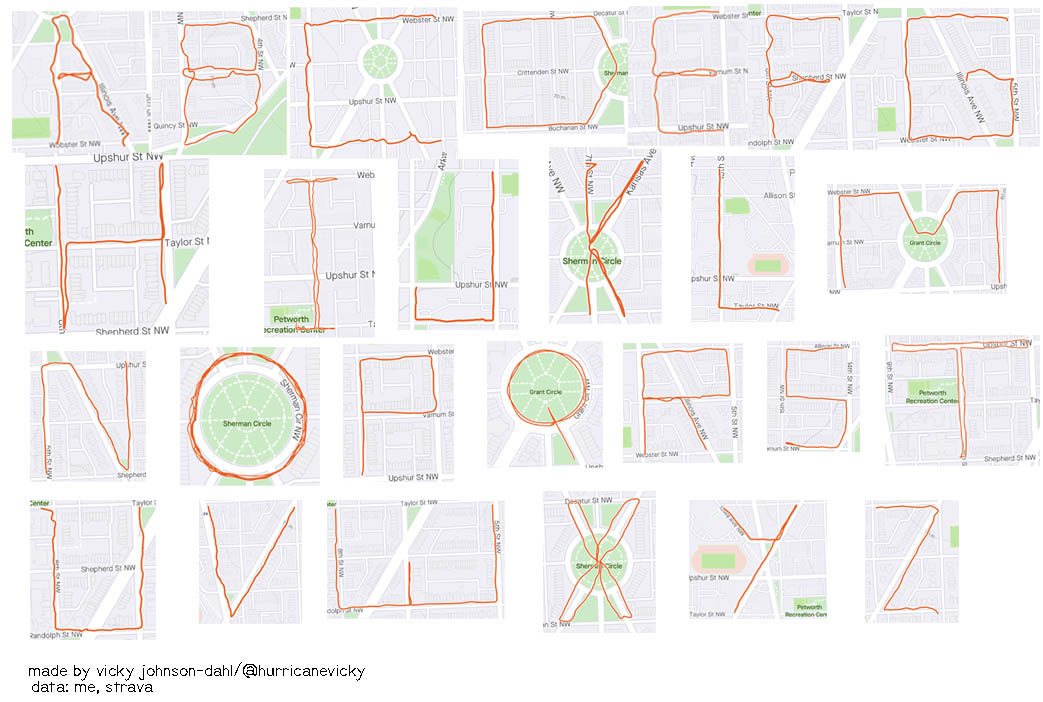 Selectively used strava on my walks/jogs this month to create the Petworth Alphabet. For all your ransom note needs!
Data from me!
Page template forked from evanca